
IMAGE
Fig. S7
- ID
- ZDB-IMAGE-140812-10
- Publication
- Kotkamp et al., 2014 - Pou5f1/Oct4 promotes cell survival via direct activation of mych expression during zebrafish gastrulation
- All Figures
- Figures for Kotkamp et al., 2014
Image
|
Figure Caption
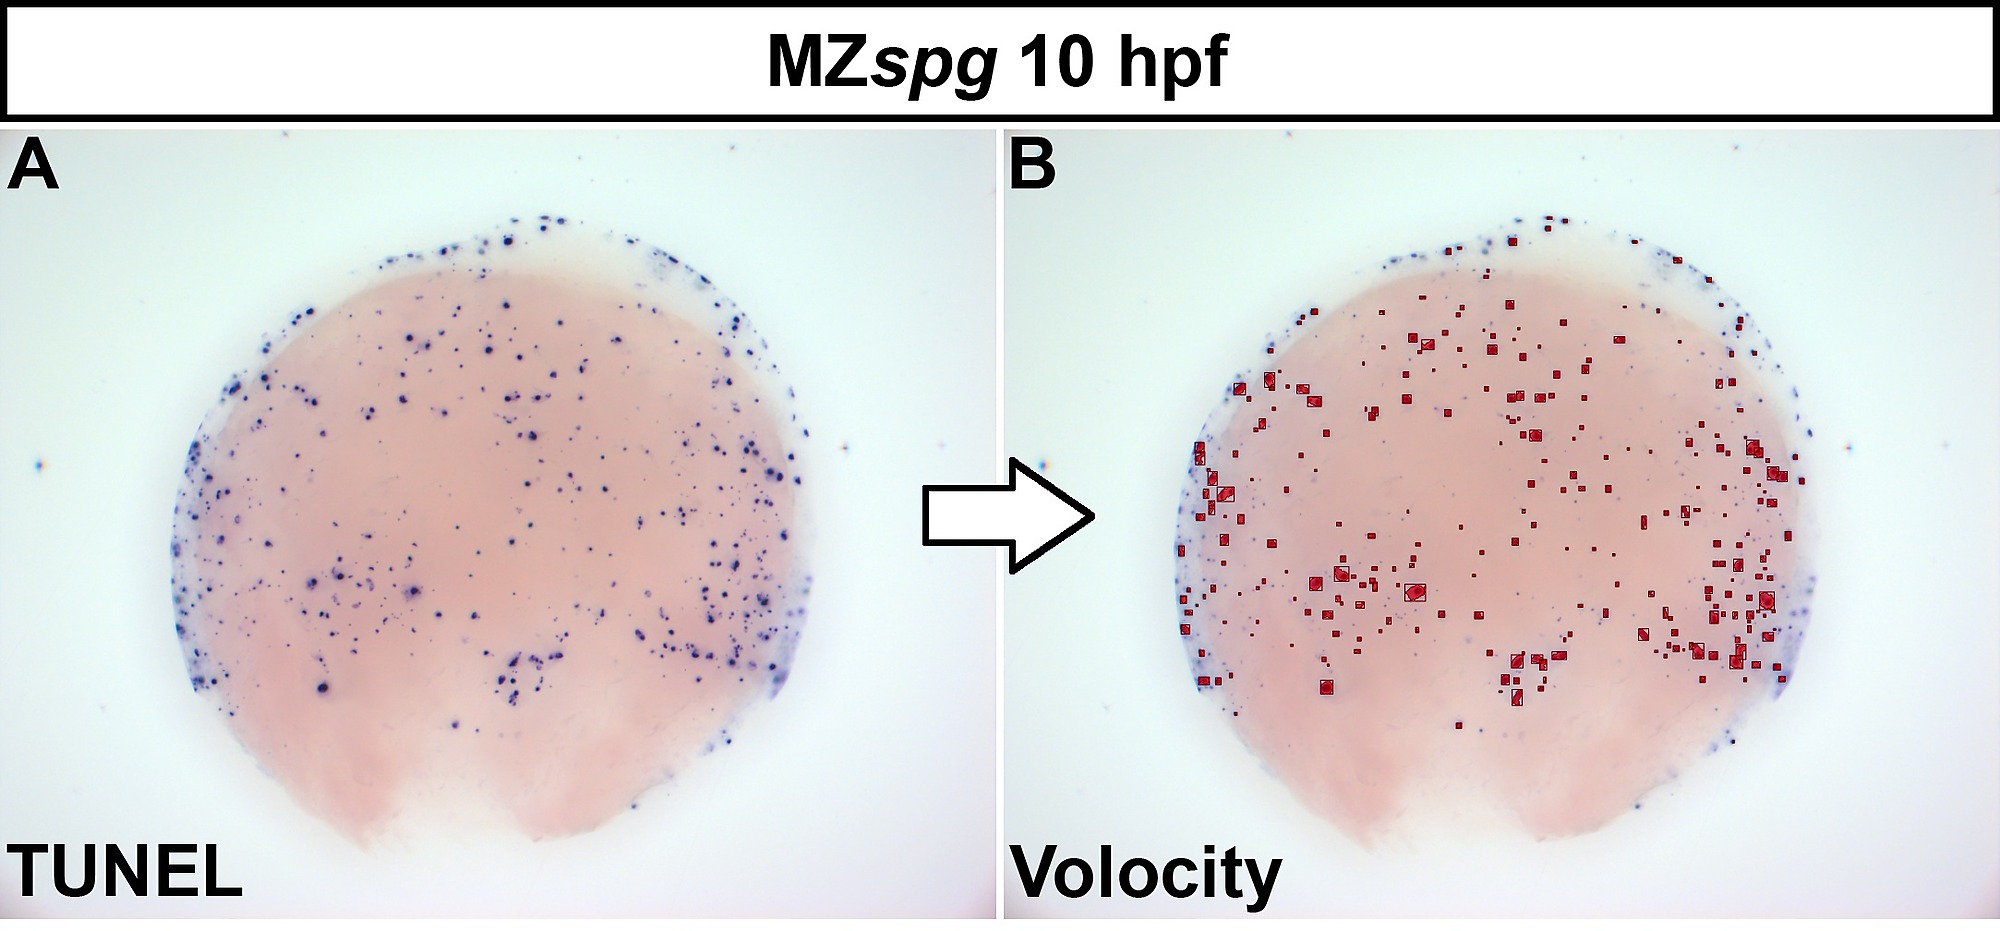
Fig. S7
Quantification of apoptosis in WT and MZspg embryos at bud stage. Detection of apoptotic cells by TUNEL staining (A) and subsequent computational image analysis (B). The images show a lateral maximum intensity projection of a z-stack taken from a single embryo. (B) The same z-stack after automatic object recognition using Volocity software (Perkin-Elmer), where most of the apoptotic cells are marked in red (B).
Acknowledgments
This image is the copyrighted work of the attributed author or publisher, and
ZFIN has permission only to display this image to its users.
Additional permissions should be obtained from the applicable author or publisher of the image.
Full text @ PLoS One