
- Title
-
Analysis of three mu-AP1 subunits during zebrafish development
- Authors
- Gariano, G., Guarienti, M., Bresciani, R., Borsani, G., Carola, G., Monti, E., Giuliani, R., Rezzani, R., Bonomini, F., Preti, A., Schu, P., and Zizioli, D.
- Source
- Full text @ Dev. Dyn.
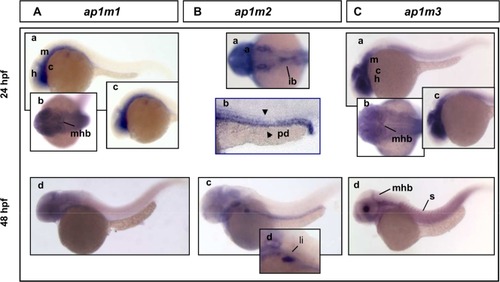
Expression analysis of zebrafish μ1 adaptins by WISH at 24 and 48 hpf. A: ap1m1 is expressed in defined brain regions at 24 hpf (a,b c) and 48 hpf (d). a,c,d: lateral view anterior to the left. b: dorsal view B: (a–d) ap1m2 transcript is expressed in intestinal bulb (a) and pronhephric ducts at 24 hpf (b). At 48 hpf the transcript expression is still detectable in the digestive tract (c) and liver (d). b,c,d lateral view anterior to the left; a: dorsal view. C: (a–d) The ap1m3 transcript is detectable at 24 (a,b,c) and 48 hpf (d). Expression in different CNS structures: midbrain, hindbrain and cerebellum (a) and midbrain–hindbrain boundary (d). At 48 hpf a label of ap1m3 is detectable in somites (d). m, midbrain; h, hindbrain; mhb, midbrain–hindbrain boundary; c, cerebellum; s, somites; pd, pronephric duct; ib, intestinal bulb; li, liver. |
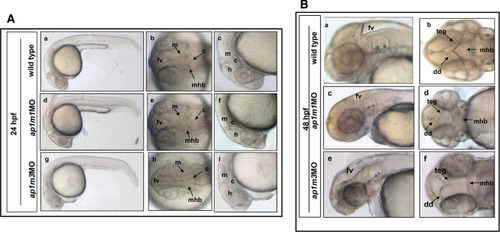
Morphological defects in ap1m1MO and ap1m3MO single morphants. Embryos were injected at the two-cell stage and examined at 24 and 48 hpf. A: Lateral view and dorsal view at 24 hpf. Single morphants of ap1m1 and ap1m3 exhibit brain malformations (d,e,g,h) with unclear boundaries between brain subdivisions, especially at hindbrain and midbrain region (f,i). ap1m3MO morphants showed poorly defined somites (g). B: At 48 hpf, CNS abnormalities became more pronounced. The forebrain ventricle in both single morphants (c,e; control in a). Dorsal view of ap1m1MO and ap1m3MO embryos revealed a severe disorganization of CNS structures (d,f). a,c,e: lateral view anterior to the left. b,d,f: dorsal view. h, hindbrain; c, cerebellum; teg, tegmentum; dd, dorsal diencephalon; mhb, midbrain–hindbrain boundary; m, midbrain; fv, forebrain ventricle. |
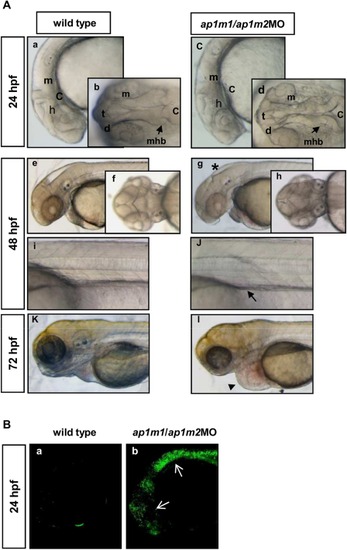
Morphological defects and apoptosis in ap1m1/ap1m2MO double morphants. A: Two-cell stage embryos were injected with 0,6 pmol/embryo of ap1m1MO plus 0,4 pmol/embryo of ap1m2MO. At 24 hpf, double morphants (c; control a) showed brain malformations with a disorganization of the midbrain–hindbrain boundary. At 48 hpf, the ventricular cavity is reduced (g,h; forebrain ventricle: black asterisk). The proximal tubule appeared irregular and not clearly defined than in wild-type embryos (i, j arrow). At 72 hpf, in double morphants the edema (arrowhead) is more pronounced (controls k,l). a, c, e, g, i, j, k, l: lateral view, anterior to the left; b,d,f,h: dorsal view. m, midbrain.; t, telencephalon; d, diencephalons; mhb, midbrain–hindbrain boundary; c, cerebellum. B: Wild-type (a) and ap1m1/ap1m2MO (b) were incubated at 24 hpf with acridine orange (AO) and then analyzed by laser confocal microscopy. Apoptotic cells are detected in the CNS of double morphants. PHENOTYPE:
|
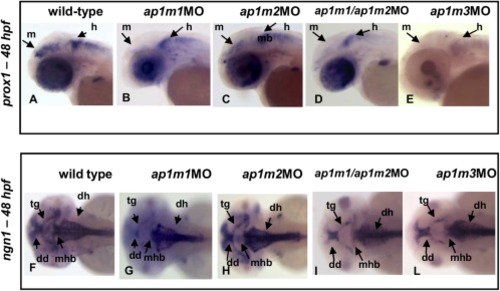
Single and double ap1m1/ap1m2MO knock-down affects CNS development. At 48 hpf, the expression of the neural markers prox1 and ngn1 were investigated by WISH in single and double morphants. Wild-type (A,F), single and double morphants (B–E,G–L). Lateral (A–E) and dorsal view (F–L) are shown. Altered expression of both markers is affected in several regions of the CNS. Abbreviations: m, midbrain; h, hindbrain; tg, tegmentum, dh, dorsal hindbrain; dd, dorsal diencephalon, mhb, midbrain–hindbrain boundary. EXPRESSION / LABELING:
|

A–E: Effects of μ1 knockdowns on pax2.1 expression. At 24 hpf, wild-type embryos, single and double morphants were analyzed by WISH for pax2.1 expression. Expression of pax2.1 is down regulated in ap1m2MO and in double morphants ap1m1/ap1m2MO (C,D; control A). pax2.1 expression is not affected in single ap1m1MO and ap1m3MO morphants (B,E). pd, pronephritic duct; (A–D) lateral views anterior to the left. EXPRESSION / LABELING:
|
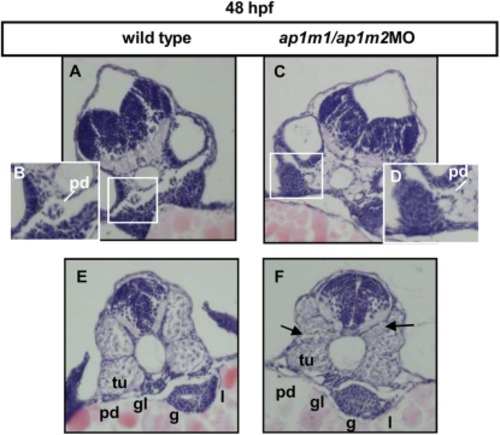
A–F: Histological analysis of double morphants. At 48 hpf zebrafish ap1m1/ap1m2MO double knockdown embryos were embedded in paraffin and sectioned at trunk level (H&E staining). Transverse sections (7μm) revealed disturbed pronephritic duct development (C,D; controls A,B); (see boxed areas in panel A and C). Structures in the anterior part as pronephric ducts, gut, liver in control (E) and double morphants (F). In double morphants the lumen of gut and the cell polarity are lost, liver morphology is severely compromised, the pronephric ducts are not well formed (F). An altered myotome organization is also detected (F, black arrows; control E). Abbreviations: pd, pronephric duct; g, gut; tu, tubule; gl, glomerule; l, liver. PHENOTYPE:
|
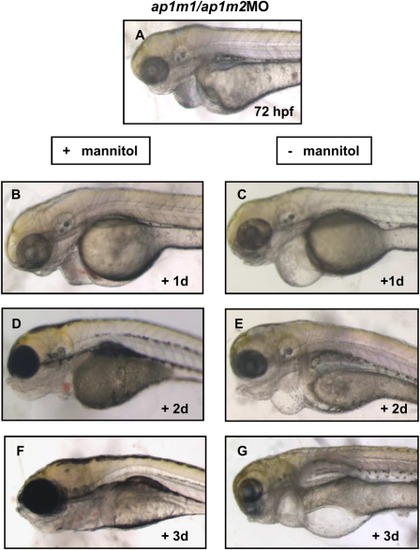
A–G: Mannitol treatment of edema. Double morphants with severe edema at 72 hpf (A), were exposed to 250 mM mannitol for 1, 2, and 3 days. After day 1 treated embryos showed a strong reduction of edema (B), which improved further (D,F; controls C,E,G). PHENOTYPE:
|
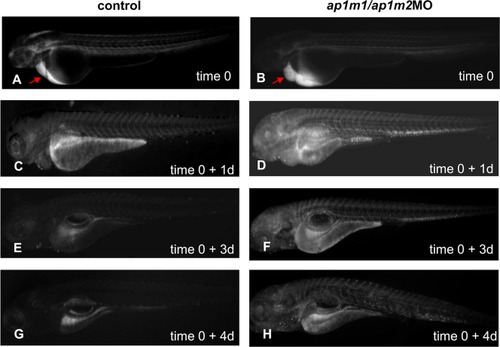
A–H: Impairment of glomerular filtration in ap1m1/ap1m2MO morphants. Control embryos (A,C,E,G) and ap1m1/ap1m2 morphants (B,D,F,H) were injected with rhodamine dextran (10.000 Mr) in the sinus venosus at 48 hpf. The dye was readily removed in control embryos (C,E,G), but it was still present in morphants even after day 4 (D,F,H). PHENOTYPE:
|