- Title
-
A Conditional Zebrafish MITF Mutation Reveals MITF Levels Are Critical for Melanoma Promotion vs. Regression In Vivo
- Authors
- Lister, J.A., Capper, A., Zeng, Z., Mathers, M.E., Richardson, J., Paranthaman, K., Jackson, I.J., and Patton, E.E.
- Source
- Full text @ J. Invest. Dermatol.
|
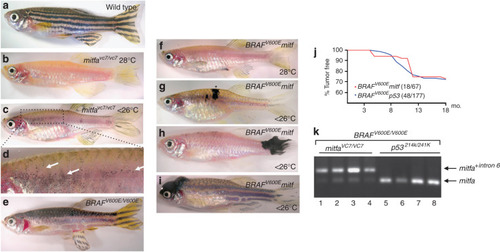
The microphthalmia-associated transcription factor (MITF) is oncogenic with BRAFV600E in melanomagenesis. (a) Adult wild-type zebrafish or (b) adult mitfavc7 mutant zebrafish living in water at 28 °C or (c, d) <26 °C. At <26 °C some melanocytes are visible in the body (d: enlarged region, white arrows). (e) Adult transgenic line expressing human BRAFV600E in the melanocytes. (f–i) Genetic crosses of BRAFV600Emitf at the semirestrictive temperatures develop nevi (*) and melanoma (on the tail of the middle fish, and on the head of the bottom fish). (j) Melanoma incidence curves of BRAFV600Ep53 and BRAFV600Emitf (<26 °C) genetic crosses. (k) Real-time PCR (RT-PCR) analysis of the mitfa transcript in BRAFV600Ep53 and BRAFV600Emitf melanomas. PHENOTYPE:
|
|
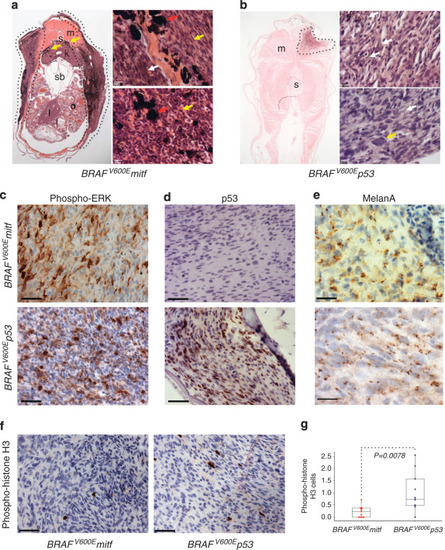
Comparative histopathology of BRAFV600E melanomas. (a) Cross-section of adult BRAFV600Emitf zebrafish with superficial spreading melanoma (dotted line). Infiltrating melanophages in the kidney are indicated (yellow arrows). i, intestine; k, kidney; l, liver; m, muscle; o, ovary; s, spinal column; sb, swimbladder. (Top and bottom panels) Hematoxylin and eosin (H&E) stain of BRAFV600Emitf melanoma, indicating large melanophages (red arrows), spindle or epithelioid cell shapes (yellow arrows), and pigmented melanoma cells (white arrow). Scale bars=20 μm. (b) Cross-section of adult BRAFV600Ep53 zebrafish with invasive melanoma (dotted line). (Top and bottom panels) H&E stain of BRAFV600Ep53 melanoma, indicating pigmented melanoma cells (white arrows) and nuclear pleomorphisms (yellow arrow). Scale bars=20 μm. (c–f) Immunohistochemistry staining for (c) phospho-extracellular signal–regulated kinase (ERK), (d) p53, (e) Melan-A, and (f) phospho-histone H3. Scale bars=50 μm. (g). Box plot of mean percentage phospho-histone H3–stained cells in BRAFV600Emitf and BRAFV600Ep53 tumors (n=11 melanomas of each genotype). Bars represent interquartile range; Student’s t-test P=0.0078. PHENOTYPE:
|
|
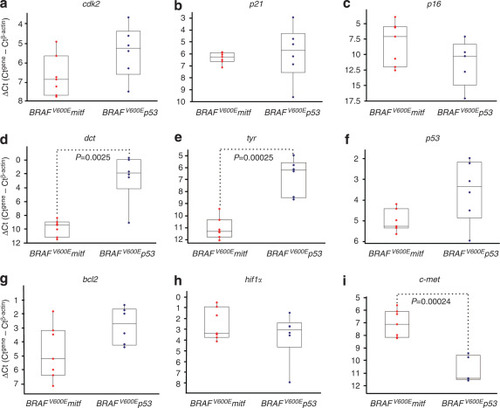
MITF target gene expression. (a–i) Box plots of quantitative real-time PCR (qRT-PCR) of MITF target genes and p53. The y-axis indicates the difference between the cycle threshold (Ct) value of the gene of interest and the Ct value of β-actin in each sample. Note that the y-axis is inverted for ease of interpretation. Bars represent interquartile range; P-values determined by Student’s t-test. Also see Supplementary Table S1 online. MITF, microphtholmia associated transcription factor. |


