
- Title
-
Involvement of Prop1 homeobox gene in the early development of fish pituitary gland
- Authors
- Angotzi, A.R., Mungpakdee, S., Stefansson, S., Male, R., and Chourrout, D.
- Source
- Full text @ Gen. Comp. Endocrinol.
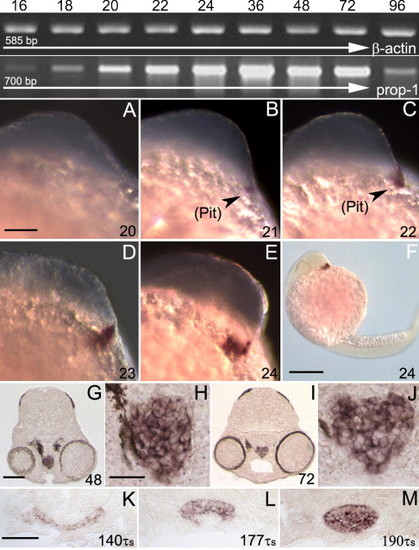
Developmental expression of zebrafish and salmon prop1. On the top of the panel, RT-PCR analysis of staged zebrafish embryos (hpf) shows prop1 up regulation between 20 and 72 hpf. A total of 15 μl RT-PCR reaction product of each sample was run into a 1.2% agarose gel and visualized after ethidium bromide staining. The expression level of β-actin was used as internal control. A standard reaction without reverse transcriptase was included to rule out contamination by genomic DNA (not shown). (A–M) ISH on whole mounts and sections to localize prop1 mRNA in zebrafish (A–J) and salmon (K–M) pituitaries; (H) and (J) are magnifications of (G) and (I), respectively. Stages are indicated on the lower-right corner of each panel in hours post fertilization (hpf) or in tau-somite units (τs). Expression domains are marked by arrows in the pituitary (Pit). Scale bar for (A–E) = 100 μm; (F) = 200 μm; (G/I) = 100 μm; (H/J) = 25 μm; (K–M) = 50 μm. EXPRESSION / LABELING:
|
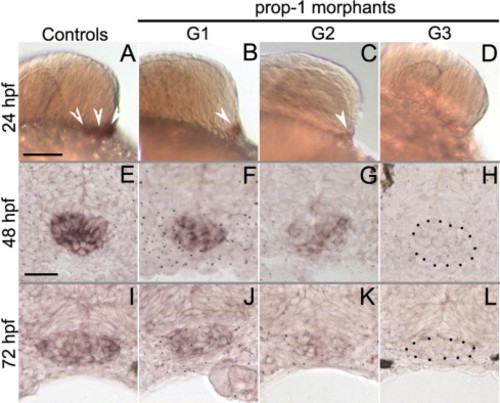
ISH analysis of MO efficiency with a prop1 cRNA probe designed in exon 2, at 24, 48 and 72 hpf (A–D; E–H; I–L, respectively). Control embryos (A/E/I). Prop1 morphants were divided into three groups according to in each group are provided in Table 1. Scale bar for (A–D) = 100 μm; (E–L) = 25 μm. EXPRESSION / LABELING:
|
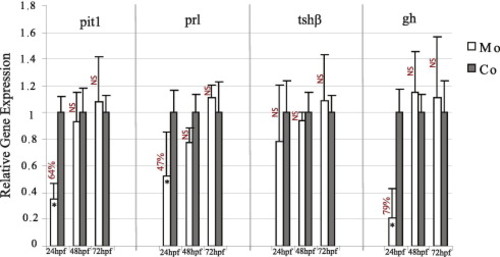
Morpholino knock down effects for pit1, prl, tshβ and gh assessed by a ΔΔCt method to determine relative gene expression from qPCR data, using ef1a as an endogenous reference gene. In an MO knockdown experiment (MO), ΔCt expression is normalized to a corresponding control sample (Co). Percent knockdown was calculated by subtracting the normalized ΔΔCt expression from 1 (defined by the level of expression for control sample) and multiplying by 100. Error bars indicate SDM for δCt expression in morpholino and control samples. Asterisks indicate statistically significant differences (P < 0.05). NS, not statistically significant. prop1 MO significantly downregulates pit1 (64%), prl (47%) and gh (79%) expression at early but not at late stages. |
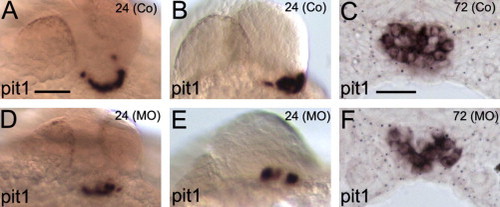
Pit1 expression patterns of controls (A–C) and morphants (D–F). At 24 hpf, pit1 expression in morphants was mostly restricted to the medial region of the adenohypophyseal placodes (D/E) whereas in most controls it expanded laterally and posterior to generate an arch-like signal (A) or in few cases a globular expression domain (B). Defective pit1 expression pattern in the adenohypophysis of morphants was still observed during subsequent development (72 hpf; F vs. C). Gene names are indicated in the lower left-hand corner of each panel. Age (in hpf) and (treatments) in the upper right-hand corner. Scale bar for (A/B; D/E) = 100 μm; (C/F) = 25 μm. EXPRESSION / LABELING:
|

ISH on transverse sections of controls (Co; A–C) and prop1 MO (MO; D–F) injected embryos at 72 hpf using RNA probes for the pituitary lineage specific markers prl gh and tshβ. All three markers were strongly expressed in the pituitaries of both control and morphant embryos. Impaired cellular organization was observed for lactotrope (D vs. A) and somatotrope (E vs. B) lineages while thyrotropes were apparently unaffected by prop1 deficiency (F vs. C). Age in hpf and (treatments) are indicated in the upper-right hand corner; gene names in the lower-left corner. All panels are equally scaled (scale bar = 25 μm). EXPRESSION / LABELING:
PHENOTYPE:
|
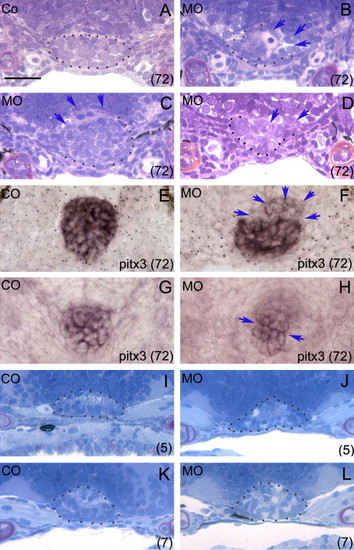
Pituitary histology in prop1 MO and control injected embryos observed on plastic sections (A–D; I–L) and by ISH using pitx3 probe mRNA (E–H). (E/F) are ISH on cryosections while (G/H) are whole mounts subsequently sectioned with vibratome. Treatments are indicated in the upper left corner. Gene names and stages are indicated in the lower-right corner of each panel (A–H, hpf; I–L, dpf). Dotted lines delimit detectable pituitary boundaries; blue arrows point to altered morphology. All panels are equally scaled (scale bar = 25 μm). EXPRESSION / LABELING:
PHENOTYPE:
|
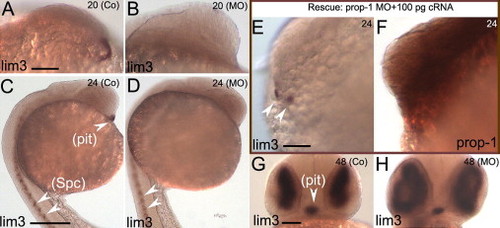
Early and late expression patterns of the adenohypophyseal marker lim3 in MO prop1 (MO; B/D/H) and control (Co; A/C/G) injected embryos, and rescue experiments at 24 hpf (E/F). At early stages (20 and 24 hpf), a drastic reduction of lim3 expression was observed in the pituitary anlage but not in the spinal cord motoneurons of prop1 knock-down embryos compared to controls (B/D vs. A/C). Lim3 expression in the adenohypophysis was partially rescued by co-injecting prop1 MO with 100 pg of cRNA (E, arrows); in vivo integrity of prop1 cRNA was confirmed by ISH using a prop1 mRNA probe (F). At 48 hpf, adenohypophyseal lim3 expression of morphants was indistinguishable from that of controls (H vs. G). Gene names are indicated in the lower left-hand corner of each panel. Age in hpf and (treatments) in the upper right-hand corner of each panel. Pituitary (pit); spinal cord (Spc). Scale bar for (A/B; E/F; G/H) = 100 μm; (C/D) = 200 μm. EXPRESSION / LABELING:
|
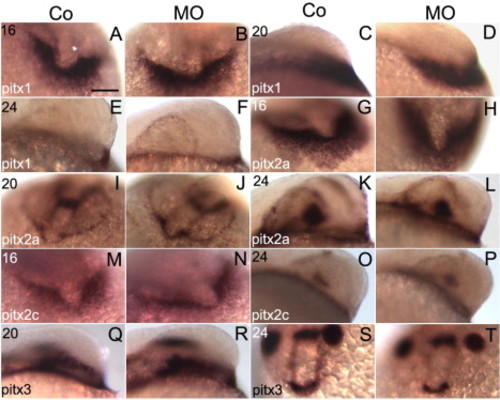
Expression studies of the early adenohypophyseal markers pitx in MO prop1 (MO) and control (Co) injected embryos. Whole-mount RNA ISH at 16, 20 and 24 hpf with probes from pitx1 (A–F), pitx2a (G–L), pitx2c (M–P) and pitx3 (Q–T). Note that expression levels of all pitx genes remained similar in prop1 morphants. The age of embryos is indicated in the upper left hand corner of each panel (in hpf). Gene names are indicated in the lower left-hand corner. All panels are equally scaled (scale bar = 100 μm). |