
Fig. 1
- ID
- ZDB-IMAGE-110621-1
- Genes
- Publication
- Angotzi et al., 2011 - Involvement of Prop1 homeobox gene in the early development of fish pituitary gland
- All Figures
- Figures for Angotzi et al., 2011
|
Fig. 1
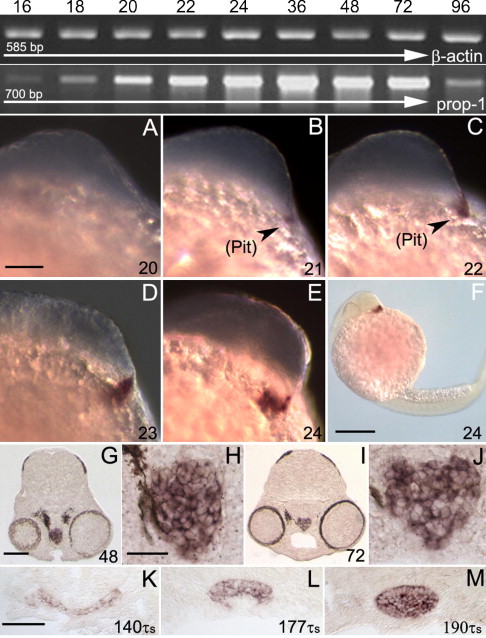
Developmental expression of zebrafish and salmon prop1. On the top of the panel, RT-PCR analysis of staged zebrafish embryos (hpf) shows prop1 up regulation between 20 and 72 hpf. A total of 15 μl RT-PCR reaction product of each sample was run into a 1.2% agarose gel and visualized after ethidium bromide staining. The expression level of β-actin was used as internal control. A standard reaction without reverse transcriptase was included to rule out contamination by genomic DNA (not shown). (A–M) ISH on whole mounts and sections to localize prop1 mRNA in zebrafish (A–J) and salmon (K–M) pituitaries; (H) and (J) are magnifications of (G) and (I), respectively. Stages are indicated on the lower-right corner of each panel in hours post fertilization (hpf) or in tau-somite units (τs). Expression domains are marked by arrows in the pituitary (Pit). Scale bar for (A–E) = 100 μm; (F) = 200 μm; (G/I) = 100 μm; (H/J) = 25 μm; (K–M) = 50 μm.