
- Title
-
Labelling cell structures and tracking cell lineage in zebrafish using SNAP-tag
- Authors
- Campos, C., Kamiya, M., Banala, S., Johnsson, K., and González-Gaitán, M.
- Source
- Full text @ Dev. Dyn.

H2A-SNAP labeling in live zebrafish embryos. A: Quantification and comparison of lethality and abnormal development between wild type and SNAP injected embryos at 15–17 somites and at 36 hr post-fertilization (hpf). B–D: Wild type embryos injected with (B) BG-DAF, (C) TMR Star, or (D) BG-Cy5 substrates. E–G: Confocal pictures of embryos injected with H2A-SNAP and (E) BG-DAF, (F) TMR Star, and (G) BG-Cy5. F: Embryo was labeled in a mosaic fashion, therefore nuclei on the right side of the midline are more strongly labeled than nuclei on the left side of this structure. B–D: Projection of 45 planes encompassing the spinal cord (dotted lines delimit the spinal cord). E–G: Projection of 5 planes in the spinal cord. B–G: 36-hpf embryos; anterior to the left. Scale bars = 20 μm. |

SNAP-tag allows labelling of different cell structures in the zebrafish embryo. A,B: Mosaic labelling of the basolateral membrane with Lgl2-SNAP and TMR Star (laser power to image Lgl2-SNAP: 20%). B: Zoom of the boxed area in A. C: Mosaic labelling of early endosomal membranes with SNAP-Rab5 and BG-DAF; arrows point at the endosomal population labelled with SNAP-Rab5 (laser power to image SNAP-Rab5: 3%). D: Mosaic labelling of early endosomal membranes with Rab5-CFP. A–D: 36-hpf embryos; projection of 5 planes of the embryo spinal cord; dotted lines delimit the embryo′s spinal cord; anterior to the left; scale bars = 10 μm. |
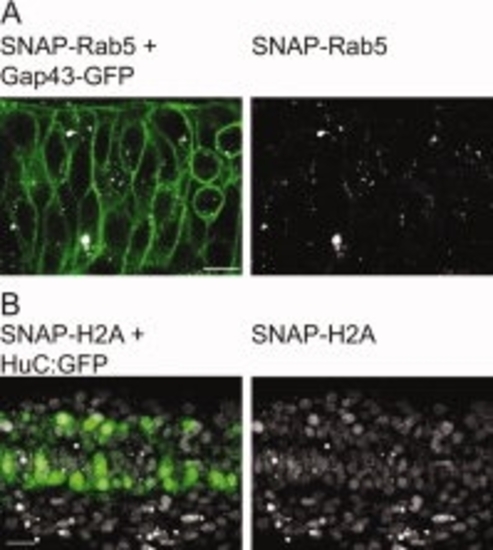
Imaging of SNAP labelled structures is compatible with the use of other FPs. A: Twelve-somite-old embryo co-injected with SNAP-Rab5, BG-Cy3, and Gap43-GFP; single plane confocal micrograph of an embryonic spinal cord (laser power to image SNAP-Rab5: 3%). B: Twenty-two-somite-old transgenic Hu:GFP embryo injected with H2A-SNAP and BG-Cy5 (laser power to image H2A-SNAP: 2%). Projection of 5 planes of the embryonic spinal cord. A,B: Anterior to the left. Scale bars in A,B = 10 μm. |
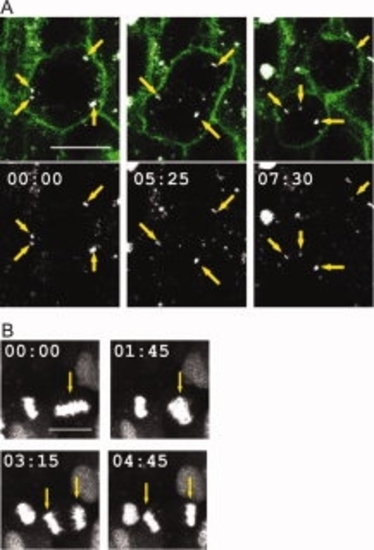
Live imaging of cellular events using the SNAP-tag. A: Tracking of Rab5 endosomal movement in a 12-somite-old embryo labelled with SNAP-Rab5, BG-Cy3, and Gap43-GFP allows analysis of the distribution of these structures across mitosis; yellow arrows point at detected endosomal vesicles (laser power to image SNAP-Rab5: 3%). B: Projection of 5 confocal micrographs of a mitotic cell in the zebrafish spinal cord at 22 somites, labelled with H2A-SNAP and BG-Cy5; yellow arrows indicate the selected nucleus to follow during mitosis (laser power to image H2A-SNAP: 10%). A,B: Anterior to the left; time in min:sec. Scale bars = 10 μm. |
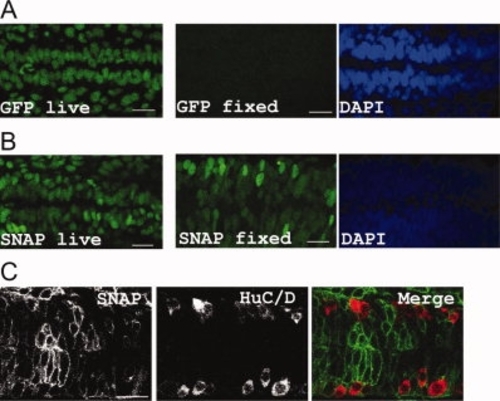
SNAP labelling resists acid fixatives and can be further detected without antibody detection. A: Histone:GFP transgenic embryo imaged before (GFP live) and after (GFP fixed) fixation in TCA: (DAPI indicates that the presence of nuclei). B: Mosaic embryo expressing H2A-SNAP and labelled with BG-DAF, imaged before (SNAP live) and after (SNAP fixed) fixation in TCA (DAPI staining indicates co-localization between the SNAP signal and the nuclei). C: Mosaic expression of Lgl2-SNAP (labelled with BG-DAF) in an embryo fixed in PFA/MeOH, further stained for HuC/D expression. A–C: Projection of 5 planes in the spinal cord of 36hpf embryos, anterior to the left. GFP- and SNAP-labeled structures were imaged with a laser power of 0,6%. Scale bars = 20 μm. |

Cell lineage analysis by combining SNAP-tag and a caged BG substrate. A: Mechanism for substrate uncaging. B: Structure of BG-CMNB-caged carboxyfluorescein; the maxima in the fluorescence excitation (ex.) and emission (em.) spectra of the substrates after reaction with SNAP are listed. C–F: Projection of confocal micrographs of an embryonic spinal cord co-injected with H2A-SNAP, BG-CMNB-caged carboxyfluorescein, and BG-Cy3. C: Before irradiation, labelling with BG-Cy3 allowed selection of a mitotic nucleus (arrow). D: Irradiation of selected nucleus with UV laser and visualization of BG-CMNB-uncaged carboxyfluorescein fluorescence. E: Zoom of box present in D. F: Daughters of mitotic cell observed in D (arrows point at daughters from cell labeled in D, arrowhead points at a cell in which uncaging also occurred at lower efficiency). G: Twenty-four hours after uncaging of the BG-CMNB-caged carboxyfluorescein, two nuclei with a stronger labeling were detected with the anti-fluorescein antibody (1 and 3), along with a third nucleus with weaker labeling (2), which was marked by an arrowhead in F. H: Sequential Z-stacks showing the three detected nuclei (1–3) in green; co-staining the labeled embryo with an anti-HuC/D antibody (white) shows that all three nuclei belong to HuC/D-expressing cells. Scale bars = 10 μm. Laser power to image H2A-SNAP and uncaged fluorophone: 0,6%. |

Effect of H2A-SNAP injection on embryo development. Non-injected (A,B) and SNAP-injected (C,D) Zebrafish embryos at 15–17 somites (A, C) and 36hpf (B,D). displaying similar morphology. A 9% decrease in survival was observed at 36hpf. |
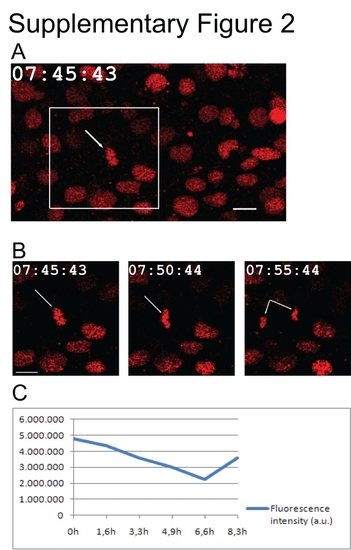
Embryo development and SNAP-tag stability after long-term time lapse. A: Confocal micrograph of a mitotic cell (white arrow) in the spinal cord of a 21-somite zebrafish embryo injected with H2A-SNAP + BG-Cy3. Groups of 12 stacks (2 μm interval) were imaged every 5 min, for 7 hr and 45 min in total. B: Close-up of the boxed area in A. C: SNAP fluorescence variation in the spinal cord of the embryo labeled in A. The decrease observed between 4.9 and 6.6 hr was due to embryo movements (see Supp. Movie S1). Quantifications were done in projections of 12 stacks encompassing the spinal cord. Scale bars = 10 µm. Time: hours:minutes:seconds. |