
|
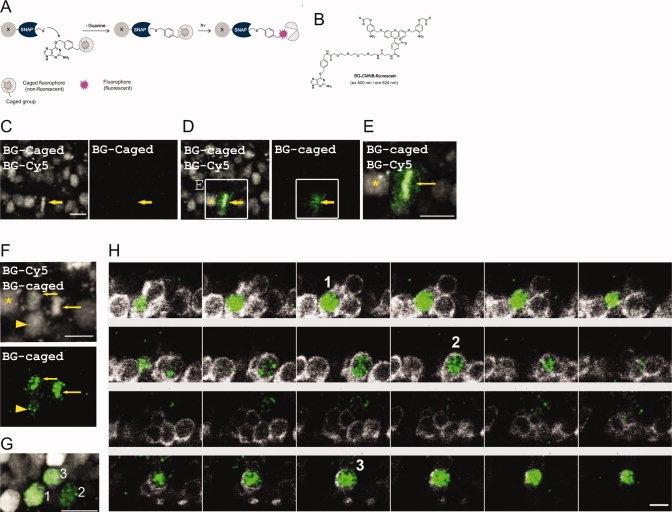
Fig. 6
Cell lineage analysis by combining SNAP-tag and a caged BG substrate. A: Mechanism for substrate uncaging. B: Structure of BG-CMNB-caged carboxyfluorescein; the maxima in the fluorescence excitation (ex.) and emission (em.) spectra of the substrates after reaction with SNAP are listed. C–F: Projection of confocal micrographs of an embryonic spinal cord co-injected with H2A-SNAP, BG-CMNB-caged carboxyfluorescein, and BG-Cy3. C: Before irradiation, labelling with BG-Cy3 allowed selection of a mitotic nucleus (arrow). D: Irradiation of selected nucleus with UV laser and visualization of BG-CMNB-uncaged carboxyfluorescein fluorescence. E: Zoom of box present in D. F: Daughters of mitotic cell observed in D (arrows point at daughters from cell labeled in D, arrowhead points at a cell in which uncaging also occurred at lower efficiency). G: Twenty-four hours after uncaging of the BG-CMNB-caged carboxyfluorescein, two nuclei with a stronger labeling were detected with the anti-fluorescein antibody (1 and 3), along with a third nucleus with weaker labeling (2), which was marked by an arrowhead in F. H: Sequential Z-stacks showing the three detected nuclei (1–3) in green; co-staining the labeled embryo with an anti-HuC/D antibody (white) shows that all three nuclei belong to HuC/D-expressing cells. Scale bars = 10 μm. Laser power to image H2A-SNAP and uncaged fluorophone: 0,6%.