
Fig. 5
- ID
- ZDB-FIG-110321-15
- Publication
- Campos et al., 2011 - Labelling cell structures and tracking cell lineage in zebrafish using SNAP-tag
- Other Figures
- All Figure Page
- Back to All Figure Page
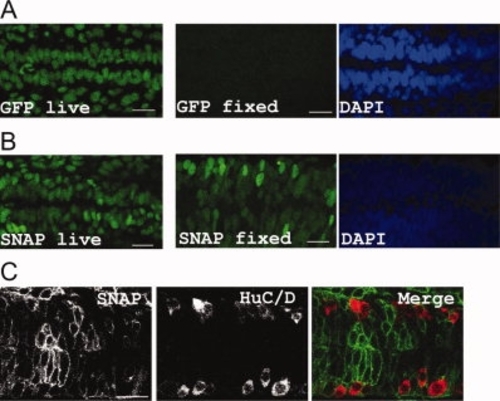
SNAP labelling resists acid fixatives and can be further detected without antibody detection. A: Histone:GFP transgenic embryo imaged before (GFP live) and after (GFP fixed) fixation in TCA: (DAPI indicates that the presence of nuclei). B: Mosaic embryo expressing H2A-SNAP and labelled with BG-DAF, imaged before (SNAP live) and after (SNAP fixed) fixation in TCA (DAPI staining indicates co-localization between the SNAP signal and the nuclei). C: Mosaic expression of Lgl2-SNAP (labelled with BG-DAF) in an embryo fixed in PFA/MeOH, further stained for HuC/D expression. A–C: Projection of 5 planes in the spinal cord of 36hpf embryos, anterior to the left. GFP- and SNAP-labeled structures were imaged with a laser power of 0,6%. Scale bars = 20 μm. |