
Fig. S2
- ID
- ZDB-FIG-110321-18
- Publication
- Campos et al., 2011 - Labelling cell structures and tracking cell lineage in zebrafish using SNAP-tag
- Other Figures
- All Figure Page
- Back to All Figure Page
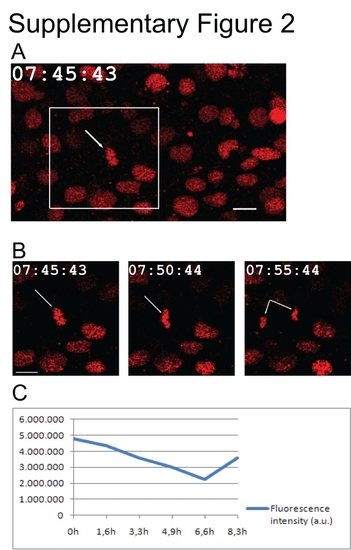
Embryo development and SNAP-tag stability after long-term time lapse. A: Confocal micrograph of a mitotic cell (white arrow) in the spinal cord of a 21-somite zebrafish embryo injected with H2A-SNAP + BG-Cy3. Groups of 12 stacks (2 μm interval) were imaged every 5 min, for 7 hr and 45 min in total. B: Close-up of the boxed area in A. C: SNAP fluorescence variation in the spinal cord of the embryo labeled in A. The decrease observed between 4.9 and 6.6 hr was due to embryo movements (see Supp. Movie S1). Quantifications were done in projections of 12 stacks encompassing the spinal cord. Scale bars = 10 µm. Time: hours:minutes:seconds. |