
|
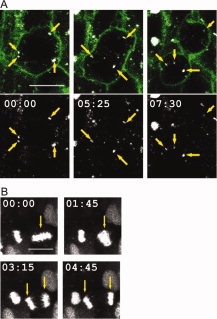
Fig. 4
Live imaging of cellular events using the SNAP-tag. A: Tracking of Rab5 endosomal movement in a 12-somite-old embryo labelled with SNAP-Rab5, BG-Cy3, and Gap43-GFP allows analysis of the distribution of these structures across mitosis; yellow arrows point at detected endosomal vesicles (laser power to image SNAP-Rab5: 3%). B: Projection of 5 confocal micrographs of a mitotic cell in the zebrafish spinal cord at 22 somites, labelled with H2A-SNAP and BG-Cy5; yellow arrows indicate the selected nucleus to follow during mitosis (laser power to image H2A-SNAP: 10%). A,B: Anterior to the left; time in min:sec. Scale bars = 10 μm.