- Title
-
Kctd15 inhibits neural crest formation by attenuating Wnt/β-catenin signaling output
- Authors
- Dutta, S., and Dawid, I.B.
- Source
- Full text @ Development
|
Zebrafish kctd15 expression pattern, loss-of-function and gain-of-function phenotypes. (A-E) Wild-type embryos were hybridized in situ, with probes indicated at lower right, stages shown at lower left. Dorsal views, anterior towards the top (A-D) or left (E). (A,B) Cells in the neural plate border (NPB) express kctd15a and kctd15b. (C) dlx3b (red) and kctd15a (blue) are coexpressed at the NPB. (D,D inset) kctd15a (blue) is excluded from the premigratory neural crest (NC) expressing foxd3 (red). (E) kctd15a expression at 24 hpf. arrows, hindbrain neurons. (F-M) Embryos were injected with RNA (F-I) or MO (J-M). Lateral views, anterior to the left. Overexpression of kctd15a (G, 75/100) and ΔCkctd15a (I, 82/100) results in loss of pigmentation and a short tail, whereas ΔNkctd15a mRNA-injected embryos were normal (H, 60/60). Co-injection of Kctd15a/15b MO results in a small head and abnormal somites (K, 85/100) and subsequently increased dorsal pigmentation (M, 91/100) and loss of jaw elements (M inset, arrowhead). s, somite; t, telencephalon; teg, tegmentum; tg, trigeminal placode; LLP, lateral line primordia. Scale bars: 50 μm in A-D,L,M inset; 80 μm in E; 100 μm in F-M. EXPRESSION / LABELING:
PHENOTYPE:
|
|
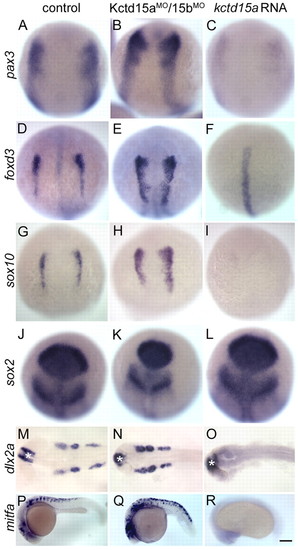
Kctd15 inhibits NC induction and differentiation. (A-R) Control embryos (control MO-injected and uninjected embryos were indistinguishable; A,D,G,J,M,P), Kctd15aMO/15bMO-injected (B,E,H,K,N,Q) and kctd15a mRNA-injected (C,F,I,L,O,R) embryos were fixed at the 1-somite stage (A-L) or at 24 hpf (M-R). Expression of pax3 (A-C), foxd3 (D-F), sox10 (G-I), sox2 (J-L), dlx2a (M-O) and mitfa (P-R) was analyzed by in situ hybridization. Morphants showed expansion of pax3 (B, 42/50), foxd3 (E, 28/35) and sox10 (H, 25/35). kctd15a mRNA-injected embryos showed inhibition of pax3 (C, 38/45), foxd3 (F, 45/50) and sox10 (I, 32/37) in the NC domain, whereas sox2 expression was preserved (K, 25/25; L, 20/20). Expression of dlx2a in the branchial arches was expanded in morphants (N, 32/44) and lost in overexpressing embryos (O, 35/40); mitfa was expanded in morphants (Q, 30/35) and lost in overexpressing embryos (R, 40/40). (A-L) Dorsal views, anterior towards the top; (M-O) dorsal views; (P-R) lateral views, anterior towards the left. Asterisk in M-O indicates dlx2a expression in the forebrain. Scale bar: 100 μm in A-L; 200 μm in M-R. EXPRESSION / LABELING:
|
|
Kctd15 inhibits the output of canonical Wnt signaling. (A) foxd3 expression in control embryos. (B) Loss of foxd3 expression in wnt8.1 morphants. (C) Injection of Wnt8.1 MO together with Kctd15a/15b MOs rescued foxd3 expression. (D) Quantification of A-C; number of embryos (n) is given above bars. (E-J) foxd3 expression in embryos treated with LiCl (E-G). Arrow in G indicates expanded expression in 26/30 embryos. (H-J) LiCl did not rescue foxd3 expression in kctd15a mRNA-injected embryos (I, 40/40; J, 50/50; numbers indicate embryos with appearance as shown in the figure). (K-M) Inhibition of foxd3 by kctd15a (K) was rescued by β-cat* mRNA (M, 41/50 showing foxd3 expression in NC domain). β-cat* mRNA alone induced ectopic expression of foxd3 (L, arrow, 25/31). (A-C,E-M) 1-somite stage; dorsal views, anterior towards top. Scale bar: 100 μm. EXPRESSION / LABELING:
PHENOTYPE:
|
|
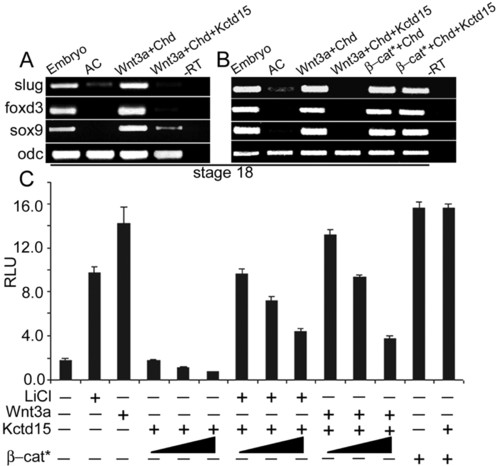
Kctd15 inhibits NC induction by antagonizing the Wnt signal. (A,B) Kctd15 suppressed NC-specific marker gene induction by Chrd + Wnt3a, but not by Chrd + β-cat* in Xenopus animal caps. Injected RNAs are indicated at the top; expression of slug, foxd3, sox9 and of odc as control was assayed by RT-PCR. (C) Wnt signaling in HEK293T cells was measured by TOPflash luciferase. Kctd15 moderately inhibited Wnt signaling stimulated by Wnt3a or LiCl but not by β-cat*. AC, uninjected animal caps; -RT, without reverse transcriptase; RLU, relative luciferase units. |
|
Expression patterns of kctd15a and kctd15b. (A-G) Wholemount in situ hybridization with kctd15a probe (C,D,G) and kctd15b probe (A,B,E,F) at different developmental stages, as indicated at the lower left of each panel. (C, inset) Two-color in situ hybridization with kctd15a (blue) and gata1 (red). (A,B) Side views; (C,D) dorsal views, anterior towards the left; (E-G) lateral views, anterior towards the left. Arrowhead, pharyngeal arches; e, eye; fb, fin bud; hb, hind brain; LLP, lateral line primordium; MBT, mid-blastula transition; op, olfactory placode; opt, optic tectum; ov, otic vesicle; pd, pronephric duct; s, somites; t, telencephalon. Scale bar: 100 μm. |
|
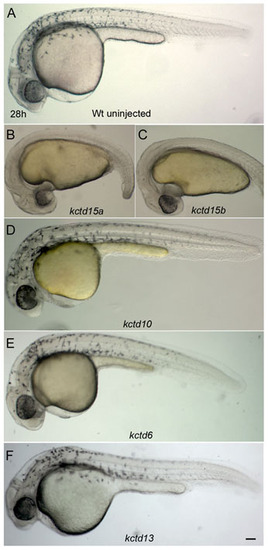
Specificity of the kctd15 RNA overexpression phenotype. (A) Control embryos. (B-F) Embryos injected with kctd15a RNA (B, 36/50) or kctd15b RNA (C, 38/50) show loss of pigmentation, yolk extension and short tail, whereas embryos injected with kctd10 RNA (D, 48/50), kctd6 RNA (E, 46/50) and kctd13 RNA (F, 44/50) are largely normal and show unaffected pigmentation. Lateral views of 30 hpf live embryos. Scale bar: 100 μm. |
|
Embryos injected with Kctd15aMO/15bMO or with kctd15a RNA show craniofacial defects. (A-C) Ventral views of Alcian Blue staining of the cranial cartilages of larvae at 120 hpf. Both manipulations resulted in abnormal arches with missing cartilage elements. Scale bar: 50 μm. |
|
Rescue of Kctd15 morphant phenotype. (A-C) Lateral views of live 26 hpf embryos. The colored box in each panel indicates the phenotype scored in D. RNAs or MOs that were injected are listed below each bar and n is given above each bar. z indicates zebrafish, X indicates Xenopus. |
|
Kctd15 morphants show expansion of NC domain. (A-F) Expression of foxd3 was analyzed by in situ hybridization in control MO-injected embryos (A,C,E) and Kctd15aMO/15bMO-injected embryos (B,D,F) at different stages. Kctd15aMO/15bMO-injected embryos show expansion of foxd3 expression at the tail bud stage (B, 25/32), the 1s stage (D, 28/35) and the 3s stage (F, 40/50). Dorsal view, anterior towards the top. tb, tail bud. Scale bar: 100 μm. |
|
kctd15 RNA overexpression affects placode development. (A-L) Control uninjected embryos (A,C,E,G,I,K) and kctd15a RNA-injected embryos (B,D,F,H,J,L) were analyzed for the expression of placodal genes. kctd15a RNA-injected embryos show expansion of eya1 (B, 52/65) and six4.1 (D, 32/48) in the anterior preplacodal domain; similarly, lim3 (F, 35/40) and prl (H, 30/35) expression were expanded in the anterior pituitary placode. The otic placode, as revealed by the early marker foxi1, is unaffected (I, J), whereas the late marker cldna indicates a reduction in size in kctd15a RNA-injected embryos (L, 40/55) as compared with controls (K). Developmental stages are indicated in the lower right of each panel; arrowheads show lim3 expression; arrows show prl expression in the anterior pituitary. (A-D,I,J) Dorsal view, anterior to the top; (E-H,K,L) lateral view, anterior to the left. Scale bars: 200 μm in A-D; 150 μm in E-H; 100 μm in I,J; 300 μm in K,L. |
|
kctd15 expression is unaltered in Wnt8.1 morphant embryos. (A,B) Embryos were injected with control MO (A) and Wnt8.1 MO (B) at the 1- to 2-cell stage and fixed at the 1s stage. Wnt8.1 MO-injected embryos show similar levels of kctd15a expression as compared with control MO-injected embryos. Dorsal views, anterior to top. Scale bar: 100 μm. |
|
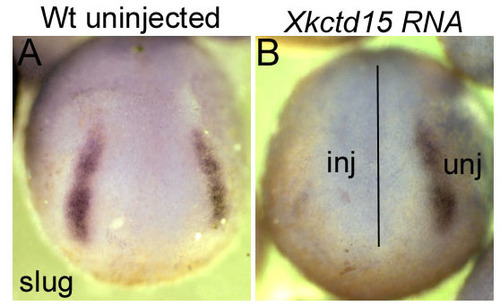
Kctd15 inhibits NC formation in Xenopus. (A,B) One blastomere was injected with Xkctd15 RNA at the 2-cell stage and embryos were fixed at stage 19. (A) Uninjected embryo. (B) Injected embryo showing loss of slug expression in the injected side. inj, injected side; unj, uninjected side. |
|
kctd15 overexpression downregulates TOPdGFP reporter expression. (A-D) Embryos from the TOPdGFP transgenic zebrafish line were analyzed for reporter gene expression at the 1s stage. (A,C) Control uninjected embryos and (B,D) kctd15b RNA-injected embryos were hybridized in situ with probes for gfp (A-D; blue) or gfp and dlx3b (C,D; red). Dorsal views, anterior to the left. Asterisks mark the midbrain-hindbrain boundary; arrows indicate the NC domain. Scale bars: 100 μm in A,B; 25 μm in C,D. |


