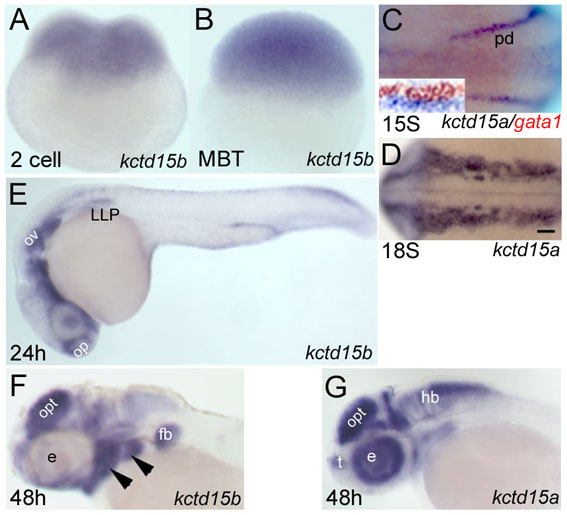
Fig. S1 Expression patterns of kctd15a and kctd15b. (A-G) Wholemount in situ hybridization with kctd15a probe (C,D,G) and kctd15b probe (A,B,E,F) at different developmental stages, as indicated at the lower left of each panel. (C, inset) Two-color in situ hybridization with kctd15a (blue) and gata1 (red). (A,B) Side views; (C,D) dorsal views, anterior towards the left; (E-G) lateral views, anterior towards the left. Arrowhead, pharyngeal arches; e, eye; fb, fin bud; hb, hind brain; LLP, lateral line primordium; MBT, mid-blastula transition; op, olfactory placode; opt, optic tectum; ov, otic vesicle; pd, pronephric duct; s, somites; t, telencephalon. Scale bar: 100 μm.
Image
Figure Caption
Acknowledgments
This image is the copyrighted work of the attributed author or publisher, and
ZFIN has permission only to display this image to its users.
Additional permissions should be obtained from the applicable author or publisher of the image.
Full text @ Development

