
Fig. S1
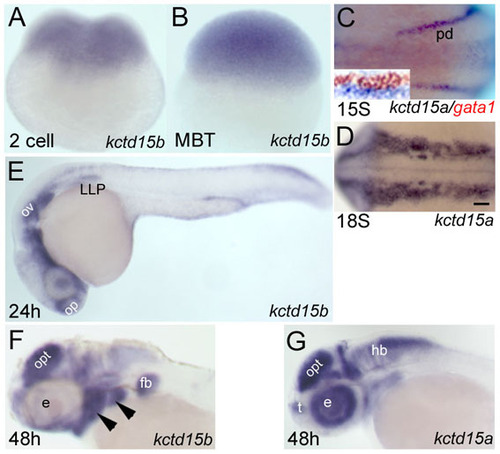
Expression patterns of kctd15a and kctd15b. (A-G) Wholemount in situ hybridization with kctd15a probe (C,D,G) and kctd15b probe (A,B,E,F) at different developmental stages, as indicated at the lower left of each panel. (C, inset) Two-color in situ hybridization with kctd15a (blue) and gata1 (red). (A,B) Side views; (C,D) dorsal views, anterior towards the left; (E-G) lateral views, anterior towards the left. Arrowhead, pharyngeal arches; e, eye; fb, fin bud; hb, hind brain; LLP, lateral line primordium; MBT, mid-blastula transition; op, olfactory placode; opt, optic tectum; ov, otic vesicle; pd, pronephric duct; s, somites; t, telencephalon. Scale bar: 100 μm. |