
- Title
-
Ooplasmic segregation in the zebrafish zygote and early embryo: Pattern of ooplasmic movements and transport pathways
- Authors
- Fuentes, R., and Fern�ndez, J.
- Source
- Full text @ Dev. Dyn.
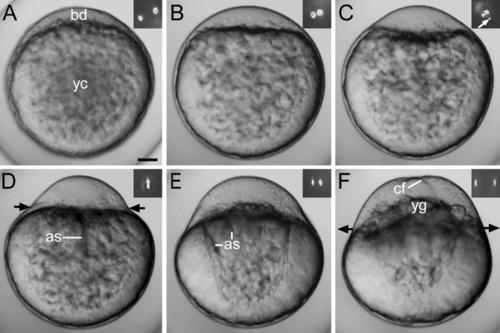
Light microscope images showing the stages in the development of a live zygote (lateral view). A: Early stage 1b. B: Mid stage 1b. C: Late stage 1b. D,E: Early stage 1c. F: Late stage 1c. Insets show the organization of the DAPI-stained nuclear DNA. During early first interphase (A-C), the zygote nucleus formed close to the DAPI-stained spot (white arrow in C). Chromosomes are shown during the first cleavage division: metaphase (D), anaphase (E), and telophase (F). Inner-directed and outer-directed black arrows indicate contraction and relaxation of the actin ring, respectively. as, axial streamers; bd, blastodisc; cf, cleavage furrow; yc, yolk cell; yg, yolk globules. Development at 21°C. Scale bar = 70 μm. |
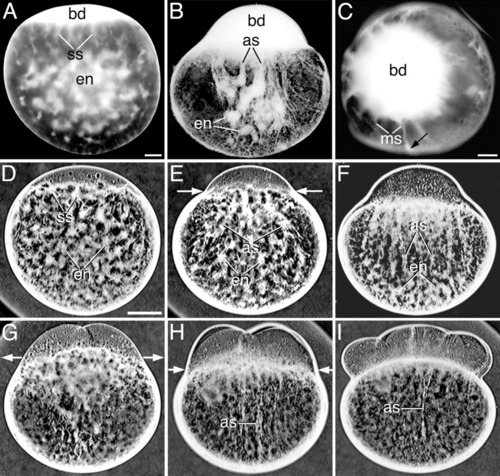
Light microscope images showing the reorganization of the endoplasm (en) in inverted contrast acid-fixed (A-C) and live whole-mounted zygotes and embryos (D-I) during the first 3 cell cycles. A: Early first interphase, lateral view. B: Early first cleavage division, lateral view. C: Early first cleavage division, animal pole view. The arrow in C points to the peripheral localization of a meridional streamer (ms). Lateral views of: D: Early first interphase. E,F: Early first cleavage division. G: Two-cell embryo. H: Four-cell embryo. I: Eight-cell embryo. as, long axial streamers; bd, blastodisc; ss, short streamers. Scale bars = 80 μm (A-C), 160 μm (D-I). |
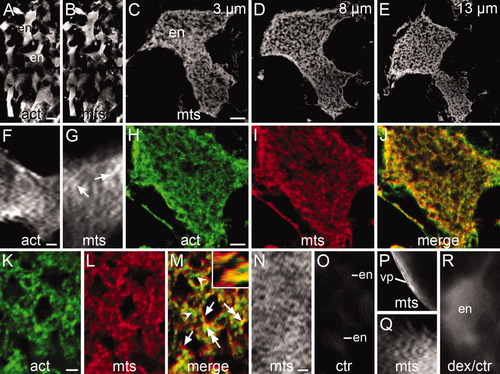
Organization of the cytoskeleton in whole-mounted early stage 1b zygotes immunostained for actin filaments (act) and/or microtubules (mts) viewed under the confocal (A-E, H-J, K-M) or fluorescent (F, G, N-R) microscope. A,B: Confocal low-magnification images of the endoplasmic lacunae (en) stained for actin filaments (act) and microtubules (mts). C-E: Deconvolved confocal images selected from a z-stack containing 15x 1 μm-thick optical sections across an endoplasmic lacuna stained for microtubules. The position of the section within the stack is indicated. F: Lacuna showing a disorganized network of actin filaments. G: Lacuna showing dispersed bundles of microtubules (arrows). H-J: Deconvolved confocal intermediate magnification images of double immunostained lacuna selected from a z-stack of 15x 1-μm-thick optical sections. Shown is the network of actin filaments (H) and microtubule bundles (I) and the merged image of them (J). In the latter image, cytoskeletal bundles are seen as green dots (actin), red dots (microtubules), or yellow to orange dots (mixed actin and microtubules). K-M: Deconvolved confocal high-magnification images of double-stained lacuna, taken from a z-stack of 18x 1-μm-thick optical sections. It shows a loosely arranged cytoskeletal network built upon intercalated bundles of actin filaments (arrowheads), bundles of microtubules (arrows), and mixed bundles of actin filaments and microtubules (double-headed arrows). This condition is also illustrated in the optical cut along the X axis shown in the inset of M. N: Network of microtubules in the ectoplasm. O: Control incubated in the second antibody only. Lacunae are barely seen after a 20-second exposure. P: Bundles of oriented microtubules in the ectoplasm of the vegetal pole (vp). Q: Weakly stained microtubules in a lacuna immunostained according to Jesuthasan and Strähle ([1996]). R: Control showing an endoplasmic lacuna filled with rhodamine-labeled dextran. Notice the absence of fibrilar profiles. Scale bars = 10 μm (A-E), 6 μm (F), 5.5 μm (G), 5 μm (H-J), 2 μm (K-M), 5.6 μm (N), 10.5 μm (O), 15 μm (P), 4 μm (Q), 2 μm (R). |
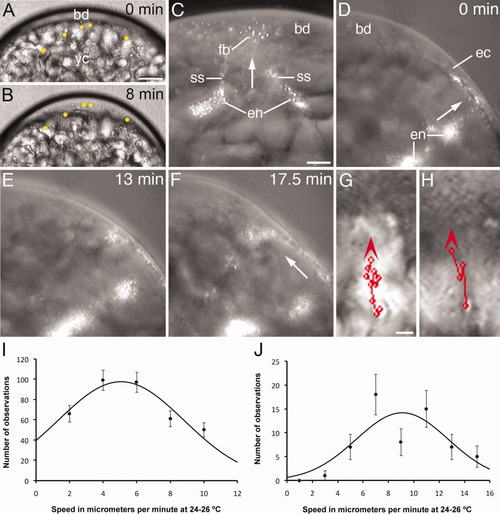
Lateral view of whole-mounted mid stage 1b zygotes and graphs illustrating the slow movement of endoplasm during the first interphase. A,B: Still frames from a light microscope time-lapse video animation, taken at 10-sec intervals, showing that enlargement of the blastodisc (bd) is accompanied by the slow incorporation of endoplasmic inclusions (marked by yellow dots). Time elapsed between the images is indicated. Development at 24°C. C: Still frame from a time-lapse video animation taken every 10 sec showing the slow transport (arrow) of fluorescent beads (fb) from two endoplasmic lacunae (en) into the blastodisc (bd) by short streamers (ss). The probe was microinjected in the medial region of the yolk cell close to the blastodisc. D-F: Still frames from a time-lapse video animation taken at 30-sec intervals, showing the slow transport of fluorescent beads from the endoplasm to the ectoplasm (ec) and from here to the blastodisc (arrows). In this case, the probe was microinjected laterally close to the ectoplasm. Development at 20°C. Time in minutes between the images is indicated. G, H: Mid stage 1b zygote showing the irregular animal-ward trajectory of inclusions across the endoplasm (G) and ectoplasm (H). The consecutive positions of the inclusion, at 30-sec intervals, are marked with a red circle and the entire trajectory with a straight line linking the circles. Arrowheads indicate the direction of movement. The entire trajectory of the inclusion was saved in the first image of the respective stack. Development at 24-25°C. yc, yolk cell. I,J: Graphs showing the distribution of speeds of slow-moving ooplasmic inclusions (I) and fluorescent beads (J) in whole-mounted stage-1b zygotes. The black line is a Gaussian curve fitted to the experimental data. The central value and standard deviations are 5.0 ± 0.4 μm/min, for the inclusions, and 9.1 ± 0.9 μm/min, for the fluorescent beads. Scale bars = 55 μm (A, B), 40 μm (C-F), 8 μm (G, H). |
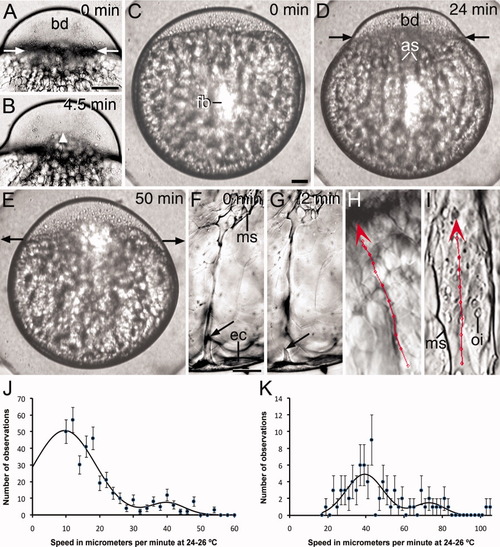
Lateral view of whole-mounted zygotes and graphs illustrating the fast movement of endoplasm during the first cleavage division. A,B: Still frames from a time-lapse video animation of light microscope images, taken at 10-sec intervals, of an early stage 1c zygote. Contraction of the actin ring has been initiated with fast movement of endoplasm and yolk globules (arrowhead) into the blastodisc (bd). Time in minutes between the images is indicated. C-E: Still frames from a time-lapse video animation, taken at 2-min intervals, of a zygote microinjected at the center of the yolk cell with rhodamine-labeled beads at early stage 1b. C: Mid stage 1b zygote showing fluorescent beads (fb) remaining at the site of injection. D: Early stage 1c zygote showing the animal-ward movement of the fluorescent beads along the axial streamers (as). E: Two-cell embryo with a relaxed actin ring and beads accumulated at the blastoderm/yolk cell boundary zone. Time elapsed between the images is indicated. Development at 20°C. F,G: Still frames from a time-lapse video animation taken at 10-sec intervals showing the transient connection (arrows) between a meridional streamer (ms) and the vegetal ectoplasm (ec). Time elapsed between the images is indicated. Development at 24°C. H,I: Fast straight movement of an ooplasmic inclusion along an axial streamer (H) and of a fluorescent bead along a meridional streamer (I). The position of the inclusion or bead was marked at each time interval (10 sec) with a red circle and the whole trajectory with a straight line linking the circles. These were saved in the first image of each stack. Arrowheads indicate the direction of movement. Development at 24-25°C. J,K: Graphs showing the distribution of speeds of fast-moving ooplasmic inclusions and fluorescent beads in whole-mounted early stage 1c zygotes. The black lines are the sum of two Gaussian curves fitted to the experimental data. The central values of the curves are: 9.6 ± 3.3 μm/min and 40.0 ± 2.8 μm/min, for the fast and ultra-fast movement of inclusions (J), and 39 ± 1.3 μm/min and 73.0 ± 3.9 μm/min, for the fast and ultra-fast movement of fluorescent beads (K). High speeds were less represented in the graphs (compare with the slow speeds in the graphs of Fig. 5) because fast-moving objects were difficult to track. oi, ooplasmic inclusion. Scale bars = 120 μm (A,B), 60 μm (C-E), 15 μm (F-I). |
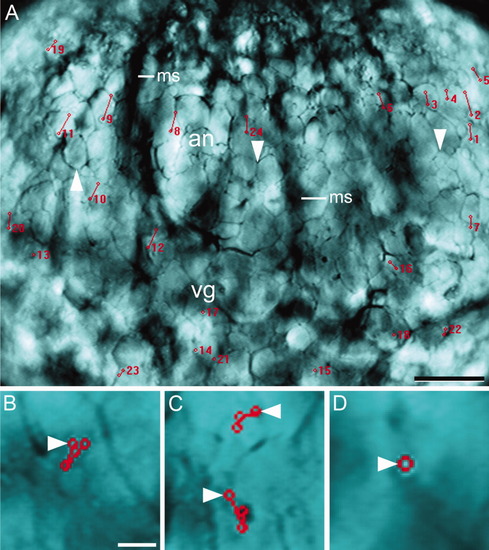
Lateral view of a whole-mounted early stage 1c zygote that shows the movement of ectoplasmic inclusions. A: First image of a stack of 18 images, taken at intervals of 10 sec, showing the movement of inclusions across the animal (an) and vegetal (vg) ectoplasm. Numbers indicate the position of the inclusions at the time they initiated a run, which was marked with a straight line between the red circles. The outline of the peripheral yolk globules (arrowheads) and the silhouette of the meridional streamers (ms) are indicated. B-D: Higher magnification of regions of the same figure showing the behavior of inclusions in the vegetal ectoplasm: (B) back-and-forth movements, (C) change of direction, (D) lack of movement. The starting point is marked by an arrowhead. Scale bars = 80 μm (A), 15 μm (B-D). |
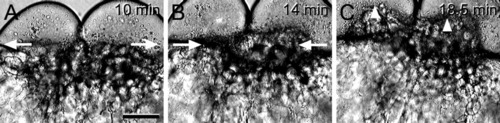
Still frames from the time-lapse video animation of Figure 6A and B, taken at 10-sec intervals. A: Relaxation of the actin ring after formation of the 2-cell embryo. B: Contraction of the actin ring during the second cleavage division. C: Entry of endoplasm and yolk globules (arrowheads) into the two blastomeres. Time elapsed between the images is indicated. Development at 25°C. Scale bar = 115 μm (A-C). |
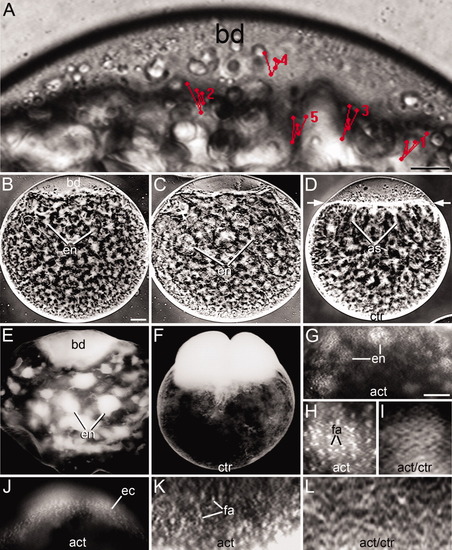
Lateral view of whole-mounted zygotes showing the movement of inclusions during pulsations and the effect of actin poisons. A: Movement of 5 inclusions during a high-frequency pulsation in a stage 1b zygote. The time-lapse for each inclusion was taken independently at 10-sec intervals, marking the successive position of the inclusion with red dots and the path with straight lines linking the dots. Numbers indicate the initial position of the inclusion. The movement pattern of the inclusions was saved in the last image of the stack. Inverted contrast live (B-D) and acid-fixed (E, F) whole-mounted zygotes showing that blockade of pulsations after drug incubation was accompanied by disorganization of the endoplasmic lacunae. B: Incubation in Cytochalasin B for 45 min. C: Incubation in Latrunculin B for 2 hr. D: Control (ctr) incubated for 45 min in aquarium water with DMSO, showing that in this case the actin ring contracted and the axial streamers formed (as). E: Latrunculin B-treated zygote showing disruption and enlargement of the endoplasmic lacunae after 80-min incubation in the drug. F: Control zygote incubated for the same amount of time in 2% DMSO. Notice the absence of endoplasmic lacunae and the division of the blastodisc. G,H: Low- and high-magnification images of fragmented actin (fa) in endoplasmic lacunae of a zygote incubated in Cytochalasin B for 80 min. I: Actin network (act) in a lacuna of a control zygote incubated in 2% DMSO for the same amount of time. J,K: Low- and high-magnification images of fragmented actin in the ectoplasm (ec) of a zygote incubated in Latranculin B for 1 h. L: Actin network of a control zygote incubated for the same amount of time in 2% DMSO. Development at 25°C. bd, blastodisc. Scale bars = 16 μm (A), 60 μm (B-F), 45 μm (G ), 25 μm (H), 7 μm (I), 12 μm (J), 20 μm (K), 7 μm (L). |
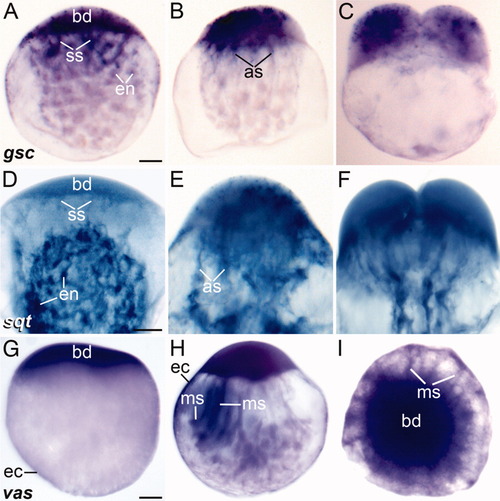
Lateral (A-H) and animal pole (I) view of whole-mounted mid stage 1b zygotes (A, D, G), early stage 1c zygotes (B, E, H, I), and early two-cell embryos (C, F) showing the distribution of gsc, sqt, and vas mRNAs by in situ hybridization. The stage of development was determined by the size of the blastodisc, distribution of endoplasmic lacunae (when visible), contraction of the actin ring, and presence of streamers. Notice the distribution of the transcripts in different ooplasmic domains. Chromogenic substrate: BM purple (A-C and G-I) or NBT/BCIP (D-F). Scale bars = 90 μm (A-C, G-I), 70 μm (D-F). |