
Fig. 1
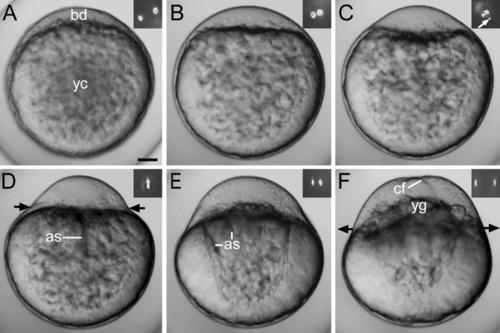
Light microscope images showing the stages in the development of a live zygote (lateral view). A: Early stage 1b. B: Mid stage 1b. C: Late stage 1b. D,E: Early stage 1c. F: Late stage 1c. Insets show the organization of the DAPI-stained nuclear DNA. During early first interphase (A-C), the zygote nucleus formed close to the DAPI-stained spot (white arrow in C). Chromosomes are shown during the first cleavage division: metaphase (D), anaphase (E), and telophase (F). Inner-directed and outer-directed black arrows indicate contraction and relaxation of the actin ring, respectively. as, axial streamers; bd, blastodisc; cf, cleavage furrow; yc, yolk cell; yg, yolk globules. Development at 21°C. Scale bar = 70 μm. |