
Fig. 7
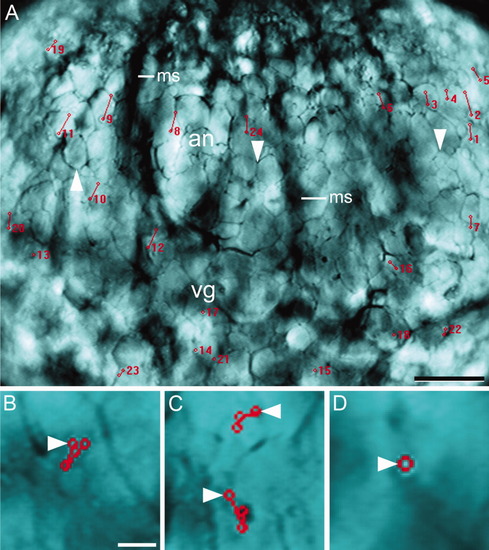
Lateral view of a whole-mounted early stage 1c zygote that shows the movement of ectoplasmic inclusions. A: First image of a stack of 18 images, taken at intervals of 10 sec, showing the movement of inclusions across the animal (an) and vegetal (vg) ectoplasm. Numbers indicate the position of the inclusions at the time they initiated a run, which was marked with a straight line between the red circles. The outline of the peripheral yolk globules (arrowheads) and the silhouette of the meridional streamers (ms) are indicated. B-D: Higher magnification of regions of the same figure showing the behavior of inclusions in the vegetal ectoplasm: (B) back-and-forth movements, (C) change of direction, (D) lack of movement. The starting point is marked by an arrowhead. Scale bars = 80 μm (A), 15 μm (B-D). |