
Fig. 6
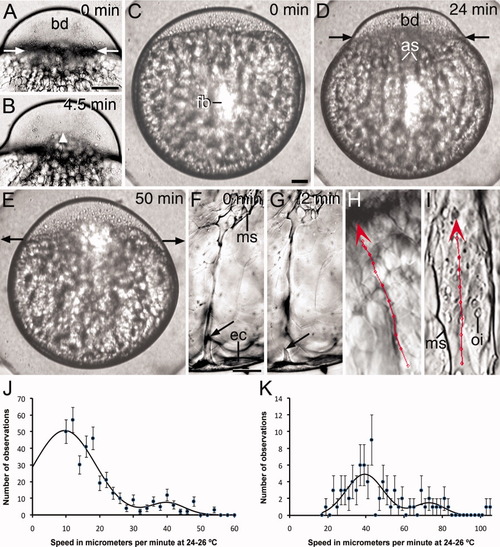
Lateral view of whole-mounted zygotes and graphs illustrating the fast movement of endoplasm during the first cleavage division. A,B: Still frames from a time-lapse video animation of light microscope images, taken at 10-sec intervals, of an early stage 1c zygote. Contraction of the actin ring has been initiated with fast movement of endoplasm and yolk globules (arrowhead) into the blastodisc (bd). Time in minutes between the images is indicated. C-E: Still frames from a time-lapse video animation, taken at 2-min intervals, of a zygote microinjected at the center of the yolk cell with rhodamine-labeled beads at early stage 1b. C: Mid stage 1b zygote showing fluorescent beads (fb) remaining at the site of injection. D: Early stage 1c zygote showing the animal-ward movement of the fluorescent beads along the axial streamers (as). E: Two-cell embryo with a relaxed actin ring and beads accumulated at the blastoderm/yolk cell boundary zone. Time elapsed between the images is indicated. Development at 20°C. F,G: Still frames from a time-lapse video animation taken at 10-sec intervals showing the transient connection (arrows) between a meridional streamer (ms) and the vegetal ectoplasm (ec). Time elapsed between the images is indicated. Development at 24°C. H,I: Fast straight movement of an ooplasmic inclusion along an axial streamer (H) and of a fluorescent bead along a meridional streamer (I). The position of the inclusion or bead was marked at each time interval (10 sec) with a red circle and the whole trajectory with a straight line linking the circles. These were saved in the first image of each stack. Arrowheads indicate the direction of movement. Development at 24-25°C. J,K: Graphs showing the distribution of speeds of fast-moving ooplasmic inclusions and fluorescent beads in whole-mounted early stage 1c zygotes. The black lines are the sum of two Gaussian curves fitted to the experimental data. The central values of the curves are: 9.6 ± 3.3 μm/min and 40.0 ± 2.8 μm/min, for the fast and ultra-fast movement of inclusions (J), and 39 ± 1.3 μm/min and 73.0 ± 3.9 μm/min, for the fast and ultra-fast movement of fluorescent beads (K). High speeds were less represented in the graphs (compare with the slow speeds in the graphs of Fig. 5) because fast-moving objects were difficult to track. oi, ooplasmic inclusion. Scale bars = 120 μm (A,B), 60 μm (C-E), 15 μm (F-I). |