
|
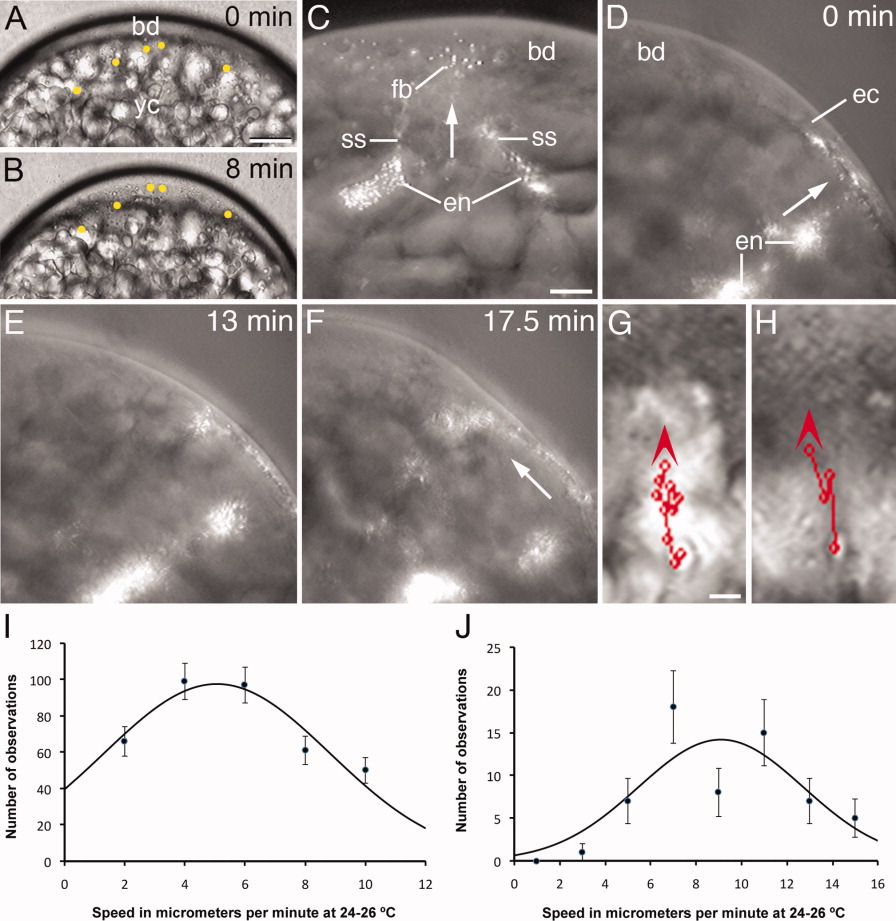
Fig. 5 Lateral view of whole-mounted mid stage 1b zygotes and graphs illustrating the slow movement of endoplasm during the first interphase. A,B: Still frames from a light microscope time-lapse video animation, taken at 10-sec intervals, showing that enlargement of the blastodisc (bd) is accompanied by the slow incorporation of endoplasmic inclusions (marked by yellow dots). Time elapsed between the images is indicated. Development at 24°C. C: Still frame from a time-lapse video animation taken every 10 sec showing the slow transport (arrow) of fluorescent beads (fb) from two endoplasmic lacunae (en) into the blastodisc (bd) by short streamers (ss). The probe was microinjected in the medial region of the yolk cell close to the blastodisc. D-F: Still frames from a time-lapse video animation taken at 30-sec intervals, showing the slow transport of fluorescent beads from the endoplasm to the ectoplasm (ec) and from here to the blastodisc (arrows). In this case, the probe was microinjected laterally close to the ectoplasm. Development at 20°C. Time in minutes between the images is indicated. G, H: Mid stage 1b zygote showing the irregular animal-ward trajectory of inclusions across the endoplasm (G) and ectoplasm (H). The consecutive positions of the inclusion, at 30-sec intervals, are marked with a red circle and the entire trajectory with a straight line linking the circles. Arrowheads indicate the direction of movement. The entire trajectory of the inclusion was saved in the first image of the respective stack. Development at 24-25°C. yc, yolk cell. I,J: Graphs showing the distribution of speeds of slow-moving ooplasmic inclusions (I) and fluorescent beads (J) in whole-mounted stage-1b zygotes. The black line is a Gaussian curve fitted to the experimental data. The central value and standard deviations are 5.0 ± 0.4 μm/min, for the inclusions, and 9.1 ± 0.9 μm/min, for the fluorescent beads. Scale bars = 55 μm (A, B), 40 μm (C-F), 8 μm (G, H).