
FIGURE
Fig. 10
Fig. 10
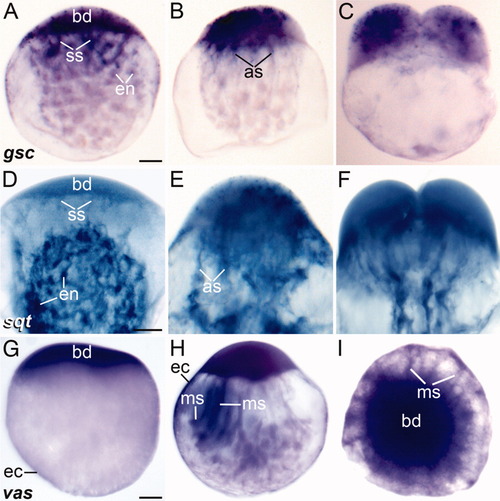
Lateral (A-H) and animal pole (I) view of whole-mounted mid stage 1b zygotes (A, D, G), early stage 1c zygotes (B, E, H, I), and early two-cell embryos (C, F) showing the distribution of gsc, sqt, and vas mRNAs by in situ hybridization. The stage of development was determined by the size of the blastodisc, distribution of endoplasmic lacunae (when visible), contraction of the actin ring, and presence of streamers. Notice the distribution of the transcripts in different ooplasmic domains. Chromogenic substrate: BM purple (A-C and G-I) or NBT/BCIP (D-F). Scale bars = 90 μm (A-C, G-I), 70 μm (D-F). |
Expression Data
Expression Detail
Antibody Labeling
Phenotype Data
Phenotype Detail
Acknowledgments
This image is the copyrighted work of the attributed author or publisher, and
ZFIN has permission only to display this image to its users.
Additional permissions should be obtained from the applicable author or publisher of the image.
Full text @ Dev. Dyn.