
FIGURE
Fig. 8
Fig. 8
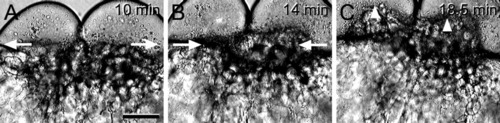
Still frames from the time-lapse video animation of Figure 6A and B, taken at 10-sec intervals. A: Relaxation of the actin ring after formation of the 2-cell embryo. B: Contraction of the actin ring during the second cleavage division. C: Entry of endoplasm and yolk globules (arrowheads) into the two blastomeres. Time elapsed between the images is indicated. Development at 25°C. Scale bar = 115 μm (A-C). |
Expression Data
Expression Detail
Antibody Labeling
Phenotype Data
Phenotype Detail
Acknowledgments
This image is the copyrighted work of the attributed author or publisher, and
ZFIN has permission only to display this image to its users.
Additional permissions should be obtained from the applicable author or publisher of the image.
Full text @ Dev. Dyn.