- Title
-
The ENTH domain protein Clint1 is required for epidermal homeostasis in zebrafish
- Authors
- Dodd, M.E., Hatzold, J., Mathias, J.R., Walters, K.B., Bennin, D.A., Rhodes, J., Kanki, J.P., Look, A.T., Hammerschmidt, M., and Huttenlocher, A.
- Source
- Full text @ Development
|
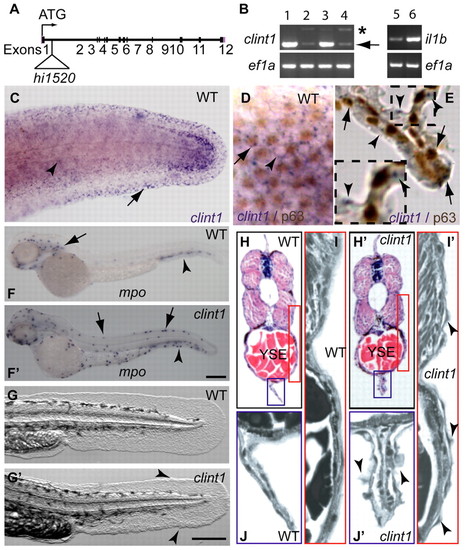
Expression of clint1 in epidermal tissues and reduced clint1 expression, inflammation and epidermal defects in hi1520 mutants. (A) Zebrafish clint1 locus showing the hi1520 insertion. (B) RT-PCR amplification of clint1, il1b and ef1a from wild-type embryos (1) and from heterozygous (3,5) and homozygous (2,4,6) clint1 mutant embryos. Arrow and asterisk indicate full-length and alternatively spliced clint1 transcripts, respectively. (C-E) Whole-mount in situ hybridization (WISH) of clint1 (purple) in wild-type (WT) embryos at 36 hpf showing epidermal expression. (C) clint1 expression within lateral epidermis (arrowhead) and fin fold (arrow). Lateral view (D) and transverse sections (E) of embryos subjected to WISH for clint1 (purple) and p63 immunolabeling (brown) showing clint1 expression in both p63-positive (arrows) and p63-negative (arrowheads) cells. (F,F′) WISH of mpo in wild-type (F) and in clint1 mutant (F′) embryos. (F) Anterior (arrow) and posterior (arrowhead, CHT) hematopoietic tissues of wild-type sibling. (F′) Dorsal ridge (arrows) and caudal fin fold (arrowhead) of clint1 mutants. (G,G′) Wild-type (G) and clint1 mutant (G′) embryos at 48 hpf showing cellular aggregates (arrowheads). (H-J′) Hematoxylin and Eosin-stained transverse sections taken anterior to cloaca of wild-type (H-J) and clint1 mutant (H′-J′) embryos at 48 hpf. Red and blue boxed regions in H,H′ are magnified in I,I′ and J,J′, respectively. Arrowheads (I′,J′) identify protruding epidermal cells. YSE, yolk sac extension. Scale bars: 200 μm. |
|
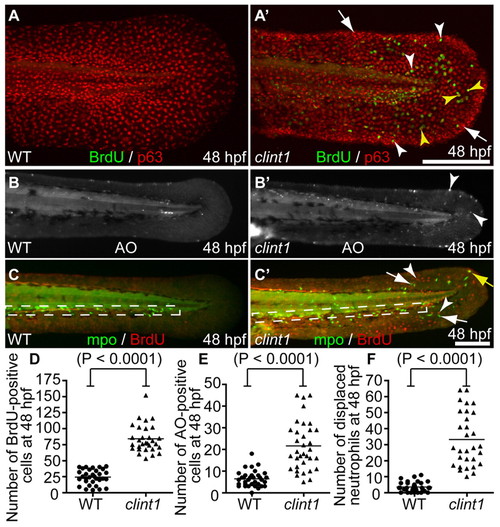
hi1520 mutant phenotypes at 48 hpf. (A-C′) Wild-type (A-C) and clint1 mutant (A′-C′) 48 hpf zebrafish embryos labeled for BrdU incorporation (green) and p63 (red) (A,A′), Acridine Orange (AO) (B,B′) or Mpo (green) and BrdU incorporation (red) (C,C′). Boxed region, caudal hematopoietic tissue (CHT). Arrowheads identify proliferation in p63-positive (yellow arrowheads) and p63-negative (white arrowheads) cells (A′,C′), and cell death (B′) in clint1 mutants. Arrows identify epidermal aggregates (A′) and neutrophils (C′) in clint1 mutants. Yellow arrow (C′) identifies a proliferating neutrophil. (D-F) Quantification of BrdU (D) and AO (E) in fin fold and overall displacement of neutrophils (F) in wild-type (circles) and clint1 mutant (triangles) embryos. Bars represent the mean. Scale bars: 200 μm. |
|
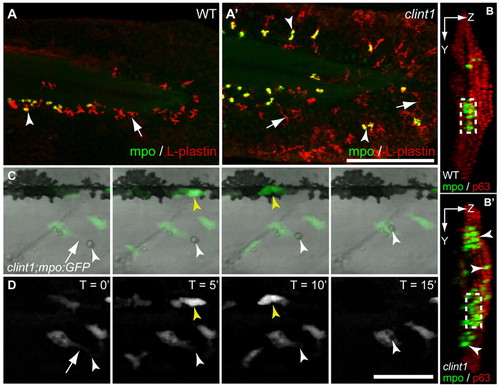
Leukocyte infiltration of epidermis and phagocytosis of debris in clint1 mutants. (A-B′) Wild-type (A,B) and clint1 mutant (A′,B′) zebrafish embryos immunolabeled at 48 hpf for Mpo (green, arrowheads) and L-plastin (red, arrows) (A,A′) or for Mpo (green, arrowheads) and p63 (red) (B,B′). (A,A′) Mpo-expressing cells also express L-plastin and appear yellow. Leukocytes in clint1 mutants infiltrate the caudal fin fold (A′,B′), the lateral epidermis covering the trunk (B′) and dorsal ridge (A′,B′). (B,B′) Confocal yz projections oriented with left side of the embryo facing to the right, dorsal up. Boxed region, CHT. (C,D) Overlay (C) and fluorescence stills (D) from time-lapse movie showing phagocytosis of cellular debris (white arrowhead) by a macrophage (arrow) in lateral epidermis of clint1 mutant at 3 dpf (see Movie 1 in the supplementary material). Yellow arrowhead identifies a neutrophil. Scale bars: 200 μm in A′; 50 μm in D. EXPRESSION / LABELING:
PHENOTYPE:
|
|
Rescue of proliferation and inflammation by clint1 mRNA overexpression in clint1 mutants. (A-E) Data (A) and representative images of control-injected mutants (B,C) and clint1 mRNA-injected partial mutants (D,E) that were immunolabeled for BrdU (green, arrowhead) and Mpo (red, arrow) (C,E). Arrowheads (D) identify epidermal aggregation. (F,G) Quantification of proliferation (F) and neutrophil displacement (G) in control-injected (circles) and clint1 mRNA-injected (triangles, 150 ng/μl; diamonds, 250 ng/μl) embryos. Bars represent the mean. Scale bars: 200 μm. |
|
clint1 MOs phenocopy hi1520 mutant phenotypes. (A,A′,C,C′) Zebrafish embryos immunolabeled at 36 hpf for BrdU incorporation (green) and p63 (red) (A,A′) or L-plastin (C,C′) following injection of control or clint1-ex1 MO into wild-type embryos. Arrowheads identify proliferative epidermal cells. Arrows identify epidermal aggregation (A′) and leukocytes (C,C′). Boxed region, CHT. (B,D) Quantification of proliferation (B) and leukocyte displacement (D) in control (circles) and clint1-ex1 MO-injected embryos (triangles). Bar represents the mean. (E) clint1 exon structure and primers used to investigate alternative splicing. (F) RT-PCR amplification of clint1 and ef1a from control and clint1-ex1 MO-injected wild-type embryos. (G,H) Embryos immunolabeled at 48 hpf for Mpo (green, arrows) following asymmetric injection of TMRD (G, arrowheads) or clint1-atg MO with TMRD (H, arrowheads) into single cells at the 8- to 32-cell stage. Scale bars: 200 μm. |
|
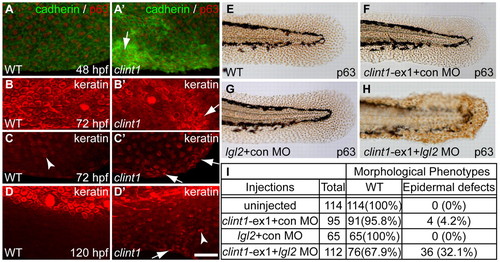
Epidermal aggregation in clint1 mutants and interaction with lgl2. (A-D′) Wild-type (A-D) and clint1 mutant (A′-D′) zebrafish embryos staged at 48 (A,A′), 72 (B,C,B′,C′) and 120 (D,D′) hpf and immunolabeled for cadherin (green) and p63 (red) (A,A′) or for keratin (red) (B-D,B′-D′). Arrows (A′-D′) identify keratinocyte aggregation. Arrowheads (C,D′) identify keratin expression within fin folds. (E-H)p63 expression highlights epidermal morphology in uninjected (E), clint1-ex1 plus control MO (F), lgl2 plus control MO (G), or clint1-ex1 plus lgl2 MO (H) co-injected wild-type embryos. (I) Quantification of morphological phenotypes observed in E-H. Scale bar: 50 μm. |
|
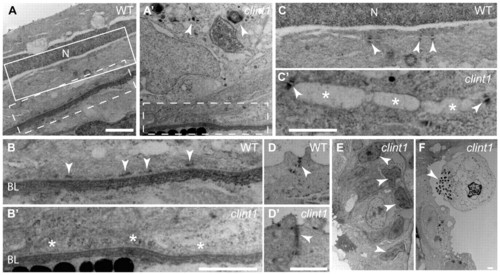
Impaired hemidesmosome formation in clint1 mutants. Transmission electron micrographs of transverse sections of wild-type (A-D) and clint1 mutant (A′-D′,E,F) zebrafish embryos staged at 4 dpf. The dashed boxed regions in A and A′ are magnified in B and B′, respectively. The solid boxed region in A is magnified in C. Arrowheads label hemidesmosomes (B), desmosomes (C,C′), tight junctions (D,D′), cellular fragmentation (A′,F) and condensed nuclei (E). Asterisks highlight absence of hemidesmosomes (B′) and detachment of epidermal cells (C′). N, nucleus; BL, basal lamina. Scale bars: 1 μm. PHENOTYPE:
|
|
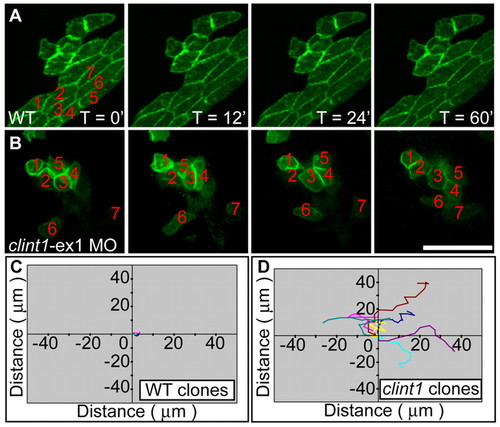
Mesenchymal behavior of epidermal cells in clint1 mutants. (A,B) Still images from in vivo time-lapse microscopy of keratinocyte clusters from uninjected (A) (see Movie 5 in the supplementary material) or clint1-ex1 MO-injected (B) (see Movie 6 in the supplementary material) Tg(β-actin:hras-eGFP) zebrafish embryos that were transplanted into ventral ectoderm of non-transgenic wild-type (A) or clint1 morphant (B) embryos, respectively. Epidermal cells from clint1 morphants exhibit loss of cell-cell contacts and increased motility (B,D). Note the change in position of the numbered cells in B. (C,D) Quantification of migration of the numbered GFP-positive keratinocytes in unlabeled wild type (C) (see Movie 5 in the supplementary material) or clint1-morphant recipients (D) (see Movie 6 in the supplementary material). Scale bar: 50 μm. |
|
Early components of the hi1520 mutant phenotype include proliferation and cell death. (A,B,D,E) Wild type (A,D) and clint1 mutants (B,E) immunolabeled for BrdU (A,B) or stained with AO (D,E) at 36 hpf. Arrows label proliferation (B) and cell death (E). (C,F) Quantification of proliferation (C) and cell death (F) in wild type (circles) and clint1 mutants (triangles). Scale bars: 200 μm |
|
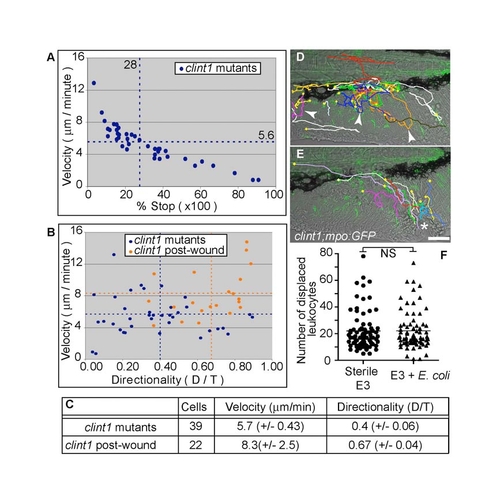
Functional neutrophil behaviors in clint1 mutants. (A-C) Quantification of migratory characteristics of neutrophils in clint1;mpo:GFP mutants before (A-C; clint1 mutants) and after (B,C; clint1 post-wound) wounding. (A) Plot of average velocity (μm/minute) versus percentage of time stopped. (B) Plot of average velocity (μm/minute) versus directionality (D/T). Each data point indicates parameters for an individual neutrophil from three clint1;mpo:GFP embryos before (blue) and after (orange) wounding. Data were averaged per embryo and are represented by dashed lines. (C) Table summarizing neutrophil tracking data from time-lapse movies of clint1;mpo:GFP embryos before (clint1 mutants, D, see Movie 2) and after (clint1 post-wound, E, see Movie 3) wounding. Standard deviations are shown. (D,E) Total migration paths taken by neutrophils overlaid onto the first frame of representative movies. (D) Arrowheads identify bidirectional tracks. Yellow squares identify starts of tracks. (E) Asterisk identifies wound. (F) Quantification of leukocyte displacement in embryos raised in sterile E3 (circles) or sterile E3 with significant amounts of E. coli added (triangles). NS, not significant. Scale bars: 50 μm. |
|
clint1-specific MOs phenocopy hi1520 mutant phenotypes. Standard control MO (con MO) (A,B), clint1-ex1 MO (C,D) or clint1-atg MO (E,F) injected wild-type embryos immunolabeled at 48 hpf for Mpo (green) and BrdU incorporation (red). Arrowheads identify epidermal aggregates (C,E) and proliferative cells (D,F), and arrows identify neutrophils (D,F). Scale bar: 200 μm. |
|
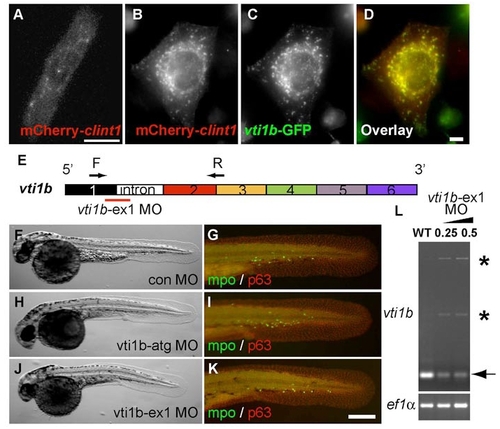
The zebrafish proteins Clint1 and Vti1b co-localize but have non-overlapping roles in epidermal development. (A-D) Expression of mCherry-clint1 in zebrafish epidermal cell (A) or mCherry-clint1 (B,D) and vti1b-GFP (C,D) in HEK293 cells. (E) Schematic of vti1b exon structure and primers used to investigate effects of vti1b-ex1 MO on splicing. (F-K) Control MO (F,G), vti1b-atg MO (H,I) or vti1b-ex1 MO (J,K) injected embryos immunolabeled for MPO (green) and p63 (red). (L) RT-PCR amplification of vti1b and ef1a from control and clint1-ex1 MO-injected wild-type embryos. Arrow and asterisks indicate full-length and alternatively spliced vti1b transcripts, respectively. Scale bars: 10 μm in A,D; 200 μm in K. |
|
Onset of clint1 mutant phenotype is unaffected by inhibition of myeloid development. (A-D′) Caudal fin fold views of wild-type (A-D) and clint1 mutant (A′-D′) embryos injected with control MO (A,A′,B,B′) or pu.1 MO (C,C′,D,D′) and immunolabeled for MPO (green) and BrdU (red, arrows). Note proliferation (arrows) in both the presence (B′) and absence (D′) of neutrophils in clint1 mutants at 48 hpf. Scale bar: 200 μm. |
|
Normal proliferation of clint1 morphant cells in a wild-type environment and unaffected Pkcζ localization in clint1 mutants. (A-B′) Cells from uninjected (A,B) or clint1-ex1 MO-injected (A′,B′) Tg(β-actin:hras-eGFP) embryos were transplanted to the ventral ectoderm of non-transgenic wild-type embryos. (C) Quantification of GFP-positive cells in unlabeled recipients at 2 and 3 dpf. (D,E) Transverse sections of wild-type (D) and clint1 mutant (E) embryos immunolabeled for Pkcζ (green) and p63 (red) and with DAPI (blue) at 48 hpf. |

