
- Title
-
Analysis of beta cell proliferation dynamics in zebrafish
- Authors
- Moro, E., Gnügge, L., Braghetta, P., Bortolussi, M., and Argenton, F.
- Source
- Full text @ Dev. Biol.

(A) Representative histology of pancreatic and gut tissue immunostained with antibodies against insulin (green) and BrdU (red). As expected, criptae of the gut, at the bottom, are strongly positive for BrdU. (B, C, E) Pancreatic islets from 9 months (B and E) and 5 months old fish (C) immunostained for insulin (green) and BrdU (red) and counterstained with DAPI (blue). White arrowheads indicate insulin and BrdU copositive cells. (D) Proliferation of beta cells, although at a low rate, was also confirmed by PCNA immunostaining as indicated by the arrowhead. (F) Histology of proliferating alpha/delta cells within an islet stained with antibodies against glucagon and somatostatin (cytoplasmic red). A white arrowhead indicates a glucagon/somatostatin producing cell copositive for BrdU (light nuclear red). (G) Representative pancreatic section showing a proliferating hormone negative cells (white arrowhead). Scale bar: 100 μm. EXPRESSION / LABELING:
|
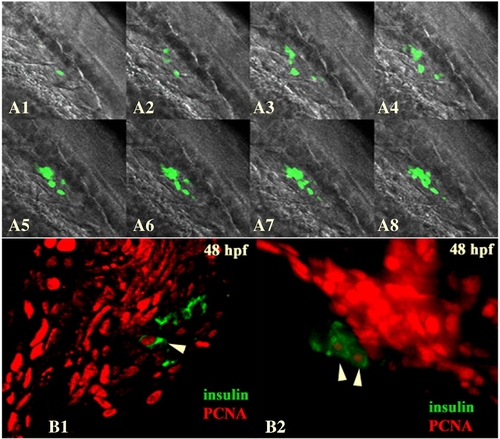
Generation of insulin-expressing beta cells during embryonic and larval stages. (A) Fig. A1 to A8 are projections of confocal stacks recorded every 30 min from a dorsal view of a representative 20–25 hpf ins:GFP transgenic embryo. The whole movie (39 stacks, 5 hrs) can be seen in the Supplemental Movie 1. (B1, B2) Immunofluorescence with a anti-PCNA (red) and anti-insulin (green) on 48 hpf larva. Proliferating beta cells are indicated by an arrowhead. EXPRESSION / LABELING:
|
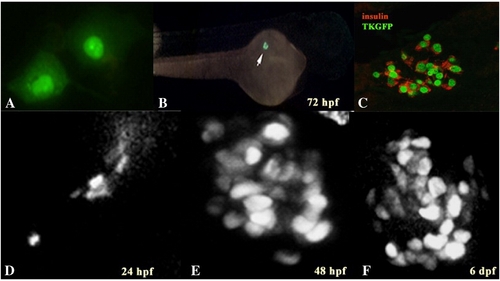
In vitro and in vivo analysis of chimeric TKGFP protein expression. (A) Fluorescence microscopy image of NIH 3T3 murine fibroblasts transfected with the plasmid pCS2-TKGFP. Cells successfully transfected display a highly intense nuclear fluorescent signal. Fluorescent cells were visualized and photographed 24 h after transfection. (B) Fluorescent microscopy image of a 72 hpf stable Tg(-1.2ins:TKGFP) zebrafish. The green fluorescent beta cell nuclei of the islet are indicated by an arrow. (C) Tg(-1.2ins:TKGFP) embryos exhibit a nuclear specific fluorescent signal in beta cells. Confocal image of a representative immunofluorescence with anti-insulin and anti-GFP antibodies on 20 dpf Tg(-1.2ins:TKGFP) larvae. A representative islet with green nuclei and insulin staining (red) is depicted. (D–F) Confocal microscopy images of GFP expression in living Tg(-1.2ins:TKGFP) embryos at different developmental stages. Beta cells express the GFP in the nucleus with a strong specific signal. Each image is a superimposed projection of a 0.1 mm scanning. (D) 24 hpf; (E) 48 hpf; (F) 6 days. EXPRESSION / LABELING:
|

Decrease in the number of beta cell fluorescent nuclei and quantitative analysis of bystander effect in Tg(-1.2ins:TKGFP) larvae treated with Ganciclovir. (A) Tg(-1.2ins:TKGFP) larvae have a decreased number of beta cells when treated with GCV (right, gray column) compared to untreated controls (left, white column); a comparable amount of larvae (+ GCV n = 20; controls, n = 18) was analyzed in repeated experiments. (B, C) Projection of a confocal stack image in a representative untreated (B) and GCV treated (C) larva after 7 days of prodrug administration. Scale bar: 10 μm. (D, E) Beta cell specific apoptosis after ganciclovir treatment. Representative double immunostaining of pancreatic tissue with cleaved-caspase 3 (red) and insulin (green) antisera. The apoptotic beta cell is marked by an arrowhead. (F, G) Comparison of an untreated (D), and a treated group of 7 days larvae (E) for their glucagon expression as revealed by in situ hybridization; glucagon mRNA levels are not affected by the GCV treatment indicating an absence of bystander effect. (H, I) Representative confocal projections of GCV-untreated (E) or GCV-treated larvae (F) displaying a comparable number of fluorescent alpha cells detected with an anti-glucagon antiserum (in red). The nuclei of beta cells expressing TKGFP (in green) are decreased in number in GCV-treated larvae. (J) Table comparing the number of alpha and delta cells in the pancreas of 5dpf Tg(-1.2ins:TKGFP) embryos treated with the prodrug and showing non significant differences with controls. (K, L) Representative pictures of embryos untreated (K) or treated (L) with ganciclovir and stained for nuclei (blue, DAPI) or somatostatin and glucagon (red). EXPRESSION / LABELING:
|

Generation of insulin-expressing beta cells by self-duplication. C1–C8 are projections of confocal stacks recorded every 20 min from a dorsal view of a 48 hpf larva. A double concomitant mitosis is clearly visible on the bottom left (white arrowheads). A reconstructed movie can be seen in the Supplemental Movie 2. EXPRESSION / LABELING:
|
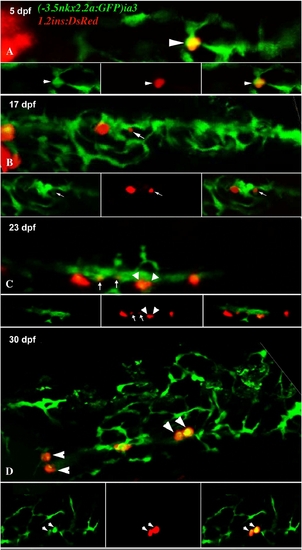
Differentiation of nkx2.2-expressing duct cells into insulin-expressing cells occurs in the intrapancreatic duct during larval stages. (A–D) Projections of confocal stack images at different larval stages of Tg(-3.5nkx2.2a:GFP)ia3/Tg(-1.2ins:dsRed) fish. Single focal plans of channels red, green and their overlay are represented at the bottom of each panel. In panel B the small arrow indicates the budding of an insulin-expressing cell from the duct. (C) Budding of two new insulin-expressing cells (arrows) occurring with a concomitant division of an insulin-expressing cell (arrowheads). (D) Pairs of insulin-expressing cells lie among nkx2.2a-expressing duct cells (arrowheads). EXPRESSION / LABELING:
|

RT-PCR analysis of handpicked islets from zebrafish at different developmental stages. N: Negative control; 5 dpf and 7 dpf: pooled islets at larval stages; 5P and 5S: pooled primary and secondary islets, respectively, from 5 months old fish; 9P and 9S: pooled primary and secondary islets, respectively, from 9 months old fish. C: Pooled whole embryos (n = 50) at 3 dpf. |
Reprinted from Developmental Biology, 332(2), Moro, E., Gnügge, L., Braghetta, P., Bortolussi, M., and Argenton, F., Analysis of beta cell proliferation dynamics in zebrafish, 299-308, Copyright (2009) with permission from Elsevier. Full text @ Dev. Biol.