
IMAGE
Fig. 5
- ID
- ZDB-IMAGE-090817-20
- Genes
- Publication
- Moro et al., 2009 - Analysis of beta cell proliferation dynamics in zebrafish
- All Figures
- Figures for Moro et al., 2009
Image
|
Figure Caption
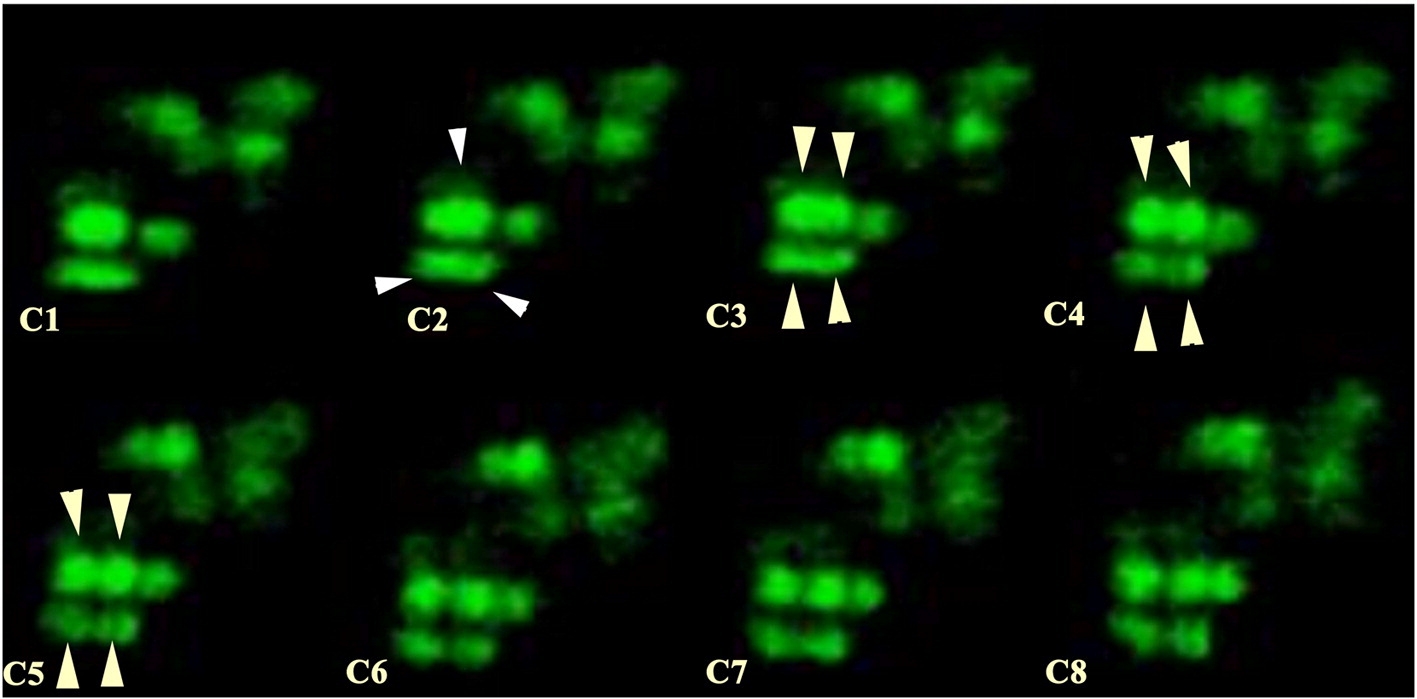
Fig. 5 Generation of insulin-expressing beta cells by self-duplication. C1–C8 are projections of confocal stacks recorded every 20 min from a dorsal view of a 48 hpf larva. A double concomitant mitosis is clearly visible on the bottom left (white arrowheads). A reconstructed movie can be seen in the Supplemental Movie 2.
Figure Data
Acknowledgments
This image is the copyrighted work of the attributed author or publisher, and
ZFIN has permission only to display this image to its users.
Additional permissions should be obtained from the applicable author or publisher of the image.
Reprinted from Developmental Biology, 332(2), Moro, E., Gnügge, L., Braghetta, P., Bortolussi, M., and Argenton, F., Analysis of beta cell proliferation dynamics in zebrafish, 299-308, Copyright (2009) with permission from Elsevier. Full text @ Dev. Biol.