
Fig. 3
- ID
- ZDB-IMAGE-090817-18
- Genes
- Antibodies
- Publication
- Moro et al., 2009 - Analysis of beta cell proliferation dynamics in zebrafish
- All Figures
- Figures for Moro et al., 2009
|
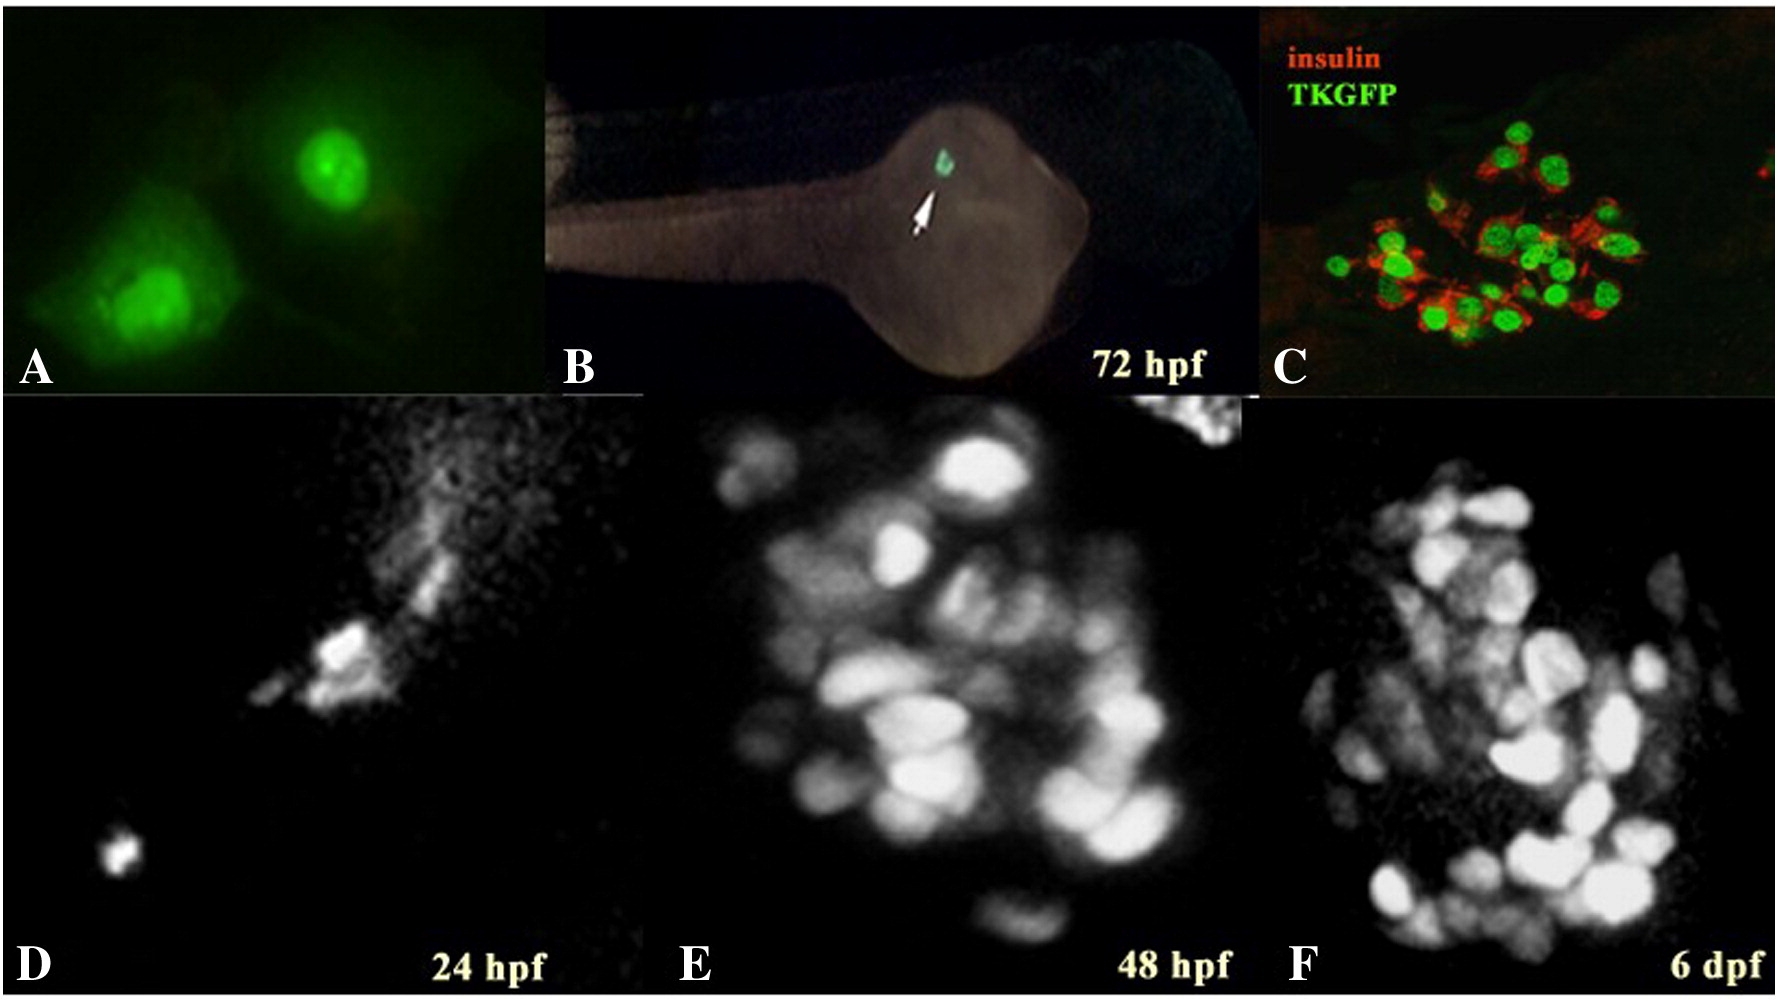
Fig. 3 In vitro and in vivo analysis of chimeric TKGFP protein expression. (A) Fluorescence microscopy image of NIH 3T3 murine fibroblasts transfected with the plasmid pCS2-TKGFP. Cells successfully transfected display a highly intense nuclear fluorescent signal. Fluorescent cells were visualized and photographed 24 h after transfection. (B) Fluorescent microscopy image of a 72 hpf stable Tg(-1.2ins:TKGFP) zebrafish. The green fluorescent beta cell nuclei of the islet are indicated by an arrow. (C) Tg(-1.2ins:TKGFP) embryos exhibit a nuclear specific fluorescent signal in beta cells. Confocal image of a representative immunofluorescence with anti-insulin and anti-GFP antibodies on 20 dpf Tg(-1.2ins:TKGFP) larvae. A representative islet with green nuclei and insulin staining (red) is depicted. (D–F) Confocal microscopy images of GFP expression in living Tg(-1.2ins:TKGFP) embryos at different developmental stages. Beta cells express the GFP in the nucleus with a strong specific signal. Each image is a superimposed projection of a 0.1 mm scanning. (D) 24 hpf; (E) 48 hpf; (F) 6 days.
Reprinted from Developmental Biology, 332(2), Moro, E., Gnügge, L., Braghetta, P., Bortolussi, M., and Argenton, F., Analysis of beta cell proliferation dynamics in zebrafish, 299-308, Copyright (2009) with permission from Elsevier. Full text @ Dev. Biol.