
- Title
-
Regulation of Embryonic Cell Adhesion by the Prion Protein
- Authors
- Málaga-Trillo, E., Solis, G.P., Schrock, Y., Geiss, C., Luncz, L., Thomanetz, V., and Stuermer, C.A.
- Source
- Full text @ PLoS Biol.
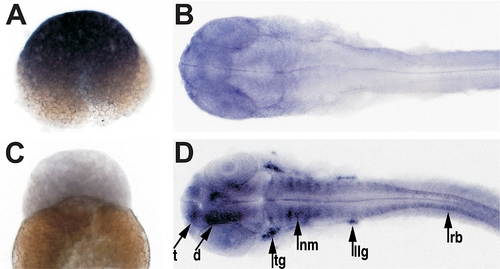
Differential Expression of PrP Genes in Zebrafish Embryos The developmental expression patterns of PrP-1 and -2 were examined by whole mount in situ RNA hybridization using gene-specific probes. At mid-blastula stages (2.5 hpf, [A and C]), PrP-1 is ubiquitously transcribed at high levels and PrP-2 is not detectable. At pharyngula stages (30 hpf, [B and D]), low levels of PrP-1 transcripts appear restricted to the forebrain and eyes, while PrP-2 becomes strongly transcribed in defined neural structures. (A and C) show lateral views; (B and D) show dorsal views. d, diencephalon; llg, lateral line ganglion; nm, neuromeres; rb, Rohon-Beard sensory neurons; t, telencephalon; tg, trigeminal ganglion. |

PrP Morpholino Knockdown and RNA Rescue in Zebrafish Embryos (A–F) Embryos were microinjected at one- to four-cell stages and photographed at 9 hpf. (A) Control embryos reach approximately 90% epiboly, as evidenced by the normal progression of the blastodermal margin (red arrowheads). (B) Epiboly in PrP-1 morphant embryos is severely impaired, and they remain arrested. (C) No appreciable morphological defects are seen in PrP-2 morphant embryos. In rescue experiments, the morpholino (MO) PrP-1 phenotype is reverted to different extents by microinjection of PrP-1 (D), PrP-2 (E), or mouse PrP (F) mRNAs. m, mouse; zf, zebrafish. (G) Western blot (WB) analysis of 6-hpf embryo cell extracts shows that PrP-1 expression (<53-kDa band) is effectively suppressed by morpholino injection. Co, control. (H and I) Embryos expressing the EGFP-PrP-1 fusion mRNA can overcome the MO PrP-1 arrest, normally reaching 75% epiboly at 8 hpf (H). In contrast, embryos expressing the corresponding control EGFP fusion mRNA remain arrested (I). (J–M) At the prim-5 (24 hpf) stage, PrP-2 morphant embryos (K and M) show severe malformations in the head region, compared to control embryos (J and L). (J and K), lateral views; (L and M), dorsal views. e, eye; fb, forebrain; hb, hindbrain; mb, hindbrain. EXPRESSION / LABELING:
PHENOTYPE:
|
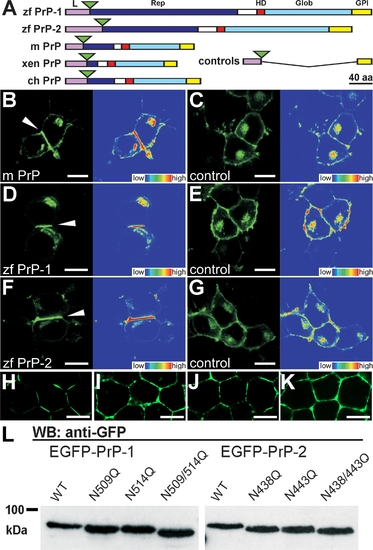
Expression of EGFP-Tagged PrPs in N2a Cells and in Zebrafish Embryos (A) EGFP fluorescent constructs used in this study: the major domains of zebrafish (zf PrP-1 and -2), mouse (m PrP), Xenopus (xen PrP), and chick (ch PrP) prion proteins are indicated: leader peptide (L) in violet, repetitive region (Rep) in blue, hydrophobic domain (HD) in red, globular domain (Glob) in light blue, and GPI-anchored peptide (GPI) in yellow. Fluorescence tags are represented as green triangles; control constructs (controls) lack PrP cores (Rep, HD, and Glob); domains are shown as previously defined [5]. (B, D, and F) N2a cells transfected with mouse PrP (B), zebrafish PrP-1 (D) and PrP-2 (F) constructs show local accumulation of the fusion proteins at cell–cell contacts (white arrowheads and fluorescence profiles, right). (C, E, and G) The corresponding control EGFP fusion constructs are evenly distributed along the plasma membrane. (H–K) For visualization of PrP expression in zebrafish deep cells, embryos were microinjected with zebrafish PrP-1 (H), PrP-2 (I), mouse PrP (J), and PrP-1 (control [K]) EGFP fusion RNAs and analyzed at the sphere stage (4 hpf). (L) Predicted N-glycosylation sites of zf PrP-1 and -2 were confirmed by Western blot (WB) analysis (anti-GFP monoclonal antibody) of extracts from N2a cells transfected with the constructs indicated above each lane. WT, wild type. (B–G) show EGFP fluorescence (left), and total fluorescence profiles (right); (H–J) show EGFP fluorescence and Nomarski overlays. Scale bars in (B–G) indicate 10 μm; scale bars in (H–J) indicate 5 μm. |

Effect of PrP-1 Knockdown in Embryonic Cell Adhesion Differences in tissue compactness between deep cells of control, morphant, and rescued embryos were evaluated at the shield stage (6 hpf ). (A) Control embryos exhibit normal tissue compactness and polygonal cell shapes. (B) Reduced cell adhesion and rounded cells are evident in PrP-1 morphant (MO) embryos. (C) Local accumulation of EGFP-PrP-1 at cell contacts (see red arrowheads in detailed overlay view of framed region, right) reverts these effects in rescued embryos. Cell outlines were digitally redrawn to help visualization of cell shape. (D–F) The loss of embryonic cell adhesion is not related to cell-death, as whole-mount TUNEL stainings of control (D), morphant (E), and ethanol-treated embryos (F) show apoptotic cells (blue staining) only in (F). Scale bars in (A–C) indicate 10 μm; scale bars in (D–F) indicate 50 μm. PHENOTYPE:
|
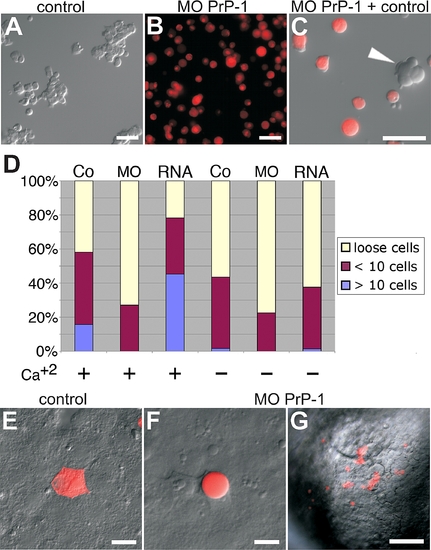
Aggregation and Cell Transplantation Assays Using PrP-1 Morphant Blastomeres Shield stage (6 hpf) embryos were dissociated to single cells, the cells were allowed to reaggregate in suspension for 45 min and were then plated out for analysis. (A) Control embryos normally form small and large cell clusters. (B) Aggregation is considerably reduced in PrP-1 morphant cells. (C) When cocultured, PrP-1 morphant cells are generally excluded from control cell aggregates (white arrowhead). (D) Quantitative differences in aggregation potential were observed between PrP-1 morphant, control, and PrP-1 overexpressing cells in the presence and absence of Ca+2; the bar graph displays the ratios of loose, small (<10 cells), and large (>10 cells) aggregates in control (Co) and PrP-1 morphant (MO) cells, 45 min after dissociation. (E–G) Cell-autonomy of the PrP-1 defect was tested by embryonic cell transplantation: Labeled control deep cells (E) integrate into the control host tissue and resume polygonal shape. In contrast, PrP-1 morphant deep cells (F and G) fail to establish cell contacts with the control host cells. Adhesive properties were evaluated at 6 hpf, 2 h after transplantation. Scale bars in (A–C, E, and F) indicate 20 μm; scale bar in (G) indicates 100 μm. PHENOTYPE:
|

Regulation of Cadherin-Mediated Cell Adhesion by PrP-1 Differences in the subcellular distribution of adherens junction components between control and PrP-1 morphant (MO) embryos were evaluated in the deep cell layer at the shield stage (6 hpf). (A–F) The normal membrane localization of E-cadherin (E-cad [A]), β-catenin (β-cat [B]), and cortical F-actin (C) in control embryos appears disrupted upon PrP-1 knockdown (D–F). (G) Western blot (WB) analysis of embryo cell extracts (6 hpf) reveals an almost complete reduction in the relative levels of mature E-cadherin (120 kDa, red arrowhead), and a slight increase in the levels of its immature form (140 kDa, black arrowhead) upon PrP-1 knockdown. γ-Tub, γ-tubulin. (H–M) Changes in the number of Rab11-positive vesicles containing E-cadherin between control (Co [H–J]) and PrP-1 morphant embryos (K–M) were analyzed by immunostaining. Compared to control embryos, PrP-1 morphant embryos exhibit a higher density of E-cadherin/Rab11 double-positive vesicles in deep cells (white circles in [J and M]). (N) The quantitative difference in the number of E-cadherin/Rab11 colocalizations per cell (y-axis) between control (Co) and PrP-1 morphant embryos (MO) was statistically significant for EVL (p = 0.0002) and DC (deep cells, p = 0.0004); triple asterisks (***) indicate statistical significance at p < 0.001. Error bars indicate SEM. (O–V) Accumulation of E-cadherin (O), β-catenin (P), Fyn tyrosine kinase (Q), and phosphotyrosine staining (R) at cell contacts between primary blastomeres derived from control embryos (white arrowheads) is lost in PrP-1 morphant blastomeres (S, T, U, and V). Scale bars in (A–F) indicate 10 μm; scale bars in (H–M and O–V) indicate 5 μm. |
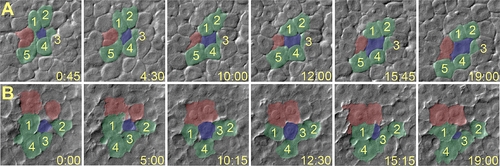
Radial Intercalation in Control and PrP-1 Morphant Embryos Cell movements in lateral regions of the epiblast (8 hpf) were imaged over 20 min using Nomarski optics. (Time in minutes and seconds is shown in the lower-right corner of each panel.) Selected frames from time-lapse video recordings were pseudocolored: intercalating and surrounding cells are shown in blue and green, respectively (after Kane et al. [22]), and cells forming new contacts are shown in red. (A) In control embryos, cells from the interior layer (blue) intercalate among cells in the exterior layer (green) and establish additional cell contacts with other cells (red). (B) In PrP-1 morphant embryos, cells from the interior layer often intercalate and then deintercalate, thereby failing to maintain attachment to cells from the exterior layer (green cells 2 and 4, and red cells). PHENOTYPE:
|

PrP-1 Regulation of Adherens, but Not Tight Junctions, in EVL Cells Differences in the subcellular distribution of various cell junction components between control and PrP-1 morphant embryos (MO) were evaluated in the polarized epithelial cells of the EVL at the shield stage (6 hpf). In control embryos, a marked membrane localization pattern can be seen for adherens junction (E-cadherin [E-cad], β-catenin [β-cat], and F-actin) (A–C) and tight junction markers (Occludin and ZO-1) (D and E). PrP-1 knockdown induces partial mislocalization of adherens junction components (F–H) but does not affect the distribution of classical tight junction markers (I and J). Scale bars indicate 20 μm. PHENOTYPE:
|
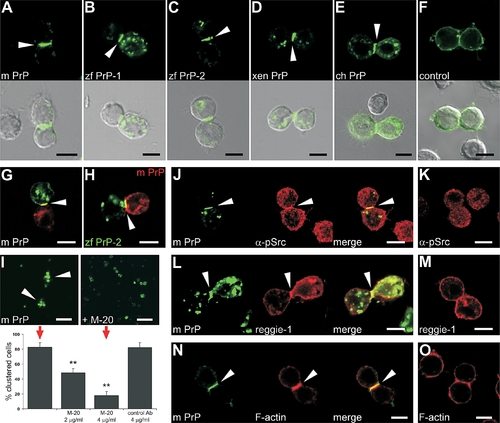
Cell Signaling and Adhesion in Drosophila S2 Cells upon PrP Expression (A–E) Expression of mouse PrP (m PrP [A]), zebrafish PrP-1 (zf PrP-1 [B]) and PrP-2 (zf PrP-2 [C]), Xenopus PrP (xen PrP [D]), and chick PrP (ch PrP [E]) EGFP fusion constructs in Drosophila nonadhesive S2 cells results in the induction of cell–cell contact formation and local PrP accumulation at cell contacts (white arrowheads). (F) Control EGFP fusion constructs do not induce this phenomenon (shown for m PrP at a fortuitous PrP-independent cell contact). (G) Cell contact formation and PrP accumulation (white arrowheads) in mixed S2 cell populations separately transfected with mouse EGFP- and DsRed-monomer-PrP constructs (G) exclude cell division artifacts. (H) The same result is obtained when mouse DsRed-monomer-PrP and zebrafish EGFP-PrP-2 constructs are used, suggesting PrP interaction across species. (I) Blocking of mouse PrP–mediated aggregation of S2 cells (red arrows, lower panel) by a polyclonal antibody against mouse PrP (M-20) shows that the formation of cell clusters (white arrowheads, upper left panel) is specifically induced by PrP. The effect was quantified as the number of cell contacts between S2 cells expressing mouse PrP in the absence (upper left) or presence (upper right) of M-20 or a control antibody at the concentrations indicated in the graph (double asterisks [**] indicate statistical significance at p < 0.01, one-way ANOVA test; error bars indicate SEM). (J–O) Strong anti–phospho-Src kinase immunostaining ([J] α-pSrc), as well as accumulation of rat reggie-1-DsRed-monomer ([L] reggie-1) and Alexa-568 Phalloidin ([N] F-actin) colocalize at mo PrP–mediated cell contacts (white arrowheads), but not at fortuitous PrP-independent cell contacts (K, M, and O). Scale bars in (A–H and J–O) indicate 5 μm; scale bar in (I) indicates 20 μm. |
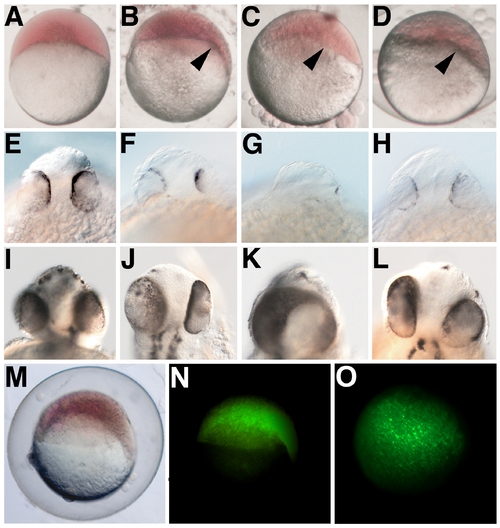
PrP Overexpression Affects Zebrafish Gastrula and Neural Stages (A) Control embryos at the dome stage (4.3 hpf) are morphologically symmetrical and initiate epiboly in a uniform manner. (B–D) Overexpression of zebrafish (zf) PrP-1 ([B] zf PrP-1), PrP-2 ([C] zf PrP-2), or mouse (m) PrP ([D] m PrP) results in earlier morphogenetic movements at one end of the blastodisc, causing a distinctive deformation of the embryo shape (-60%, n = 200, arrowheads). (E–L) At prim-5 (24 hpf) (E–H), and long pec (48 hpf) (I–L) stages, the normal development of the head in control embryos (E and I) contrasts sharply with the small brains and reduced, asymmetric (F–H and J–L), or even fused (K) eyes observed in embryos overexpressing zf PrP-1 (F and J), zf PrP-2 (G and K), or m PrP (H and L). (M–O) The asymmetric epiboly phenotype (M)-seen here for overexpression of zf PrP-1 at 6 hpf- is not due to asymmetric distribution of mRNA, as lateral (N) and animal pole (O) fluorescence views of the same embryo show. (A–D, M, and N) show lateral views; (E–L) rostral views; and (O) animal pole view. |
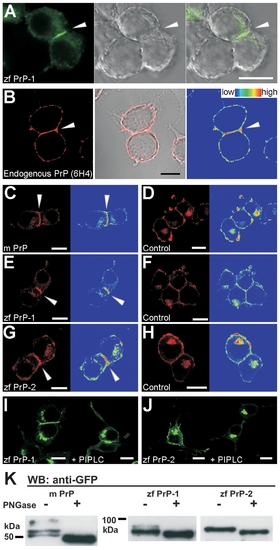
Expression of Endogenous PrP, EGFP- and DsRed-Monomer–Tagged PrPs in N2a Cells (A) Local accumulation of zebrafish PrP-1 (zf PrP-1) at a cell–cell contact (white arrowhead) is observed only when both cells forming the contact express the PrP construct. (B) Immunostaining using the 6H4 monoclonal antibody against mouse PrP shows the plasma membrane localization and accumulation at cell contacts of the endogenous PrP in N2a cells ([B], arrowhead and total fluorescence profile). (C, E, and G) Mouse PrP (m PrP) and zebrafish PrP-2 (zf PrP-2) DsRed-monomer fusion proteins localize at the plasma membrane and show accumulation at cell contacts ([C and G], arrowheads and total fluorescence profiles); zebrafish DsRed-monomer-PrP-1 (zf PrP-1) localize almost exclusively at contacts ([E], arrowhead and total fluorescence profile). (D, F, and H) Accumulation of PrP at cell contacts is lost in DsRed-monomer constructs containing only the leader and GPI-anchor signals of m PrP (D), zf PrP-1 (F), and zf PrP-2 (H). (I and J) Zebrafish EGFP-PrP-1 and -2 ([I and J], left panels) localize at the plasma membrane via a GPI anchor, as evidenced by phosphatidylinositol-specific phospholipase C (PI-PLC) treatment ([I and J], right panels). (K) Western blot analysis using an anti-GFP monoclonal antibody of cell extracts incubated in the presence (+) or absence (-) of PNGase F reveals that m PrP, zf PrP-1, and zf PrP-2 EGFP fusion proteins are N-glycosylated in N2a cells. Scale bars in (A–J) indicate 10 μm. |
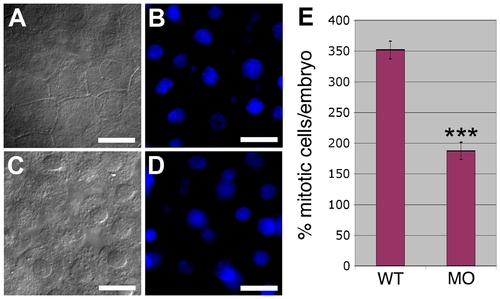
Effect of PrP-1 Knockdown on Apoptosis and Mitosis Rates (A–D) DAPI stainings on 6-hpf embryos (B and D) do not reveal morphological signs of increased apoptosis (such as chromatin condensation and nuclear fragmentation) in detached knockdown cells (C) compared to control embryonic cells (A). (E) PrP-1 morphant embryos show a clear reduction in the number of mitotic cells at 6 hpf (p = 4.3 x 10⁻⁷; triple asterisks [***] indicate statistical significance at p < 0.001); however, neither cell size nor overall cell density seems significantly affected (see main text). Scale bars in (A–D) indicate 10 μm. |
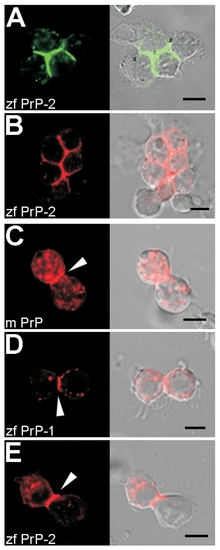
Adhesive Properties of PrPs in Drosophila S2 Cells Heterologous expression of PrPs induces cell aggregation, as shown for zebrafish PrP-2 (zf PrP-2) EGFP (A) and DsRed-monomer (B) fusion proteins. Accumulation at cell contacts of mouse PrP (m PrP, [B]), zf PrP-1 (C), and zf PrP-2 (D) DsRed-monomer fusion proteins are equally evident (arrowheads). Scale bars indicate 5 μm. |
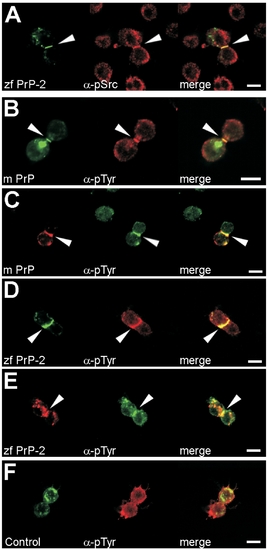
Accumulation of PrPs at Cell Contacts Correlates with Increased Levels of Tyrosine Phosphorylation in Drosophila S2 Cells (A–E) Accumulation of mouse DsRed-monomer-PrP (m PrP) and zebrafish EGFP- and DsRed-monomer-PrP-2 (zf PrP-2) at S2 cell contacts colocalizes with anti-phosphoSrc (α-pSrc, [A]) and anti-phosphotyrosine immunostaining (α-pTyr, [B–E], arrowheads), indicating recruitment and activation of Src tyrosine kinases. (F) A control mouse DsRed monomer-PrP lacking the PrP core does not cause this effect. Scale bars indicate 5 μm. |
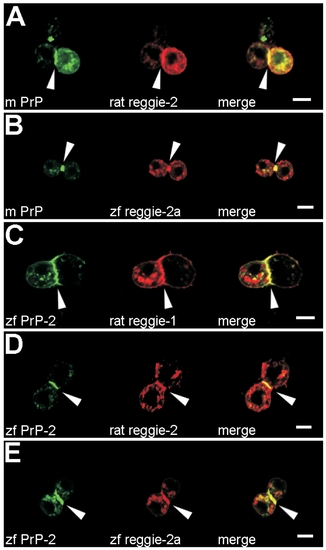
PrP-Mediated Cell Contacts Recruit Rat and Fish Reggie/Flotillin Proteins in Drosophila S2 Cells Accumulation of mouse EGFP-PrP (m PrP) and zebrafish EGFP-PrP-2 (zf PrP-2) at cell contacts colocalize with the recruitment of rat reggie-1 and -2 as well as zebrafish reggie-2a (zf reggie-2a) DsRed-monomer fusion proteins ([A–E], arrowheads). Scale bars indicate 5 μm. |