
Fig. 3
- ID
- ZDB-IMAGE-090408-25
- Publication
- Málaga-Trillo et al., 2009 - Regulation of Embryonic Cell Adhesion by the Prion Protein
- All Figures
- Figures for Málaga-Trillo et al., 2009
|
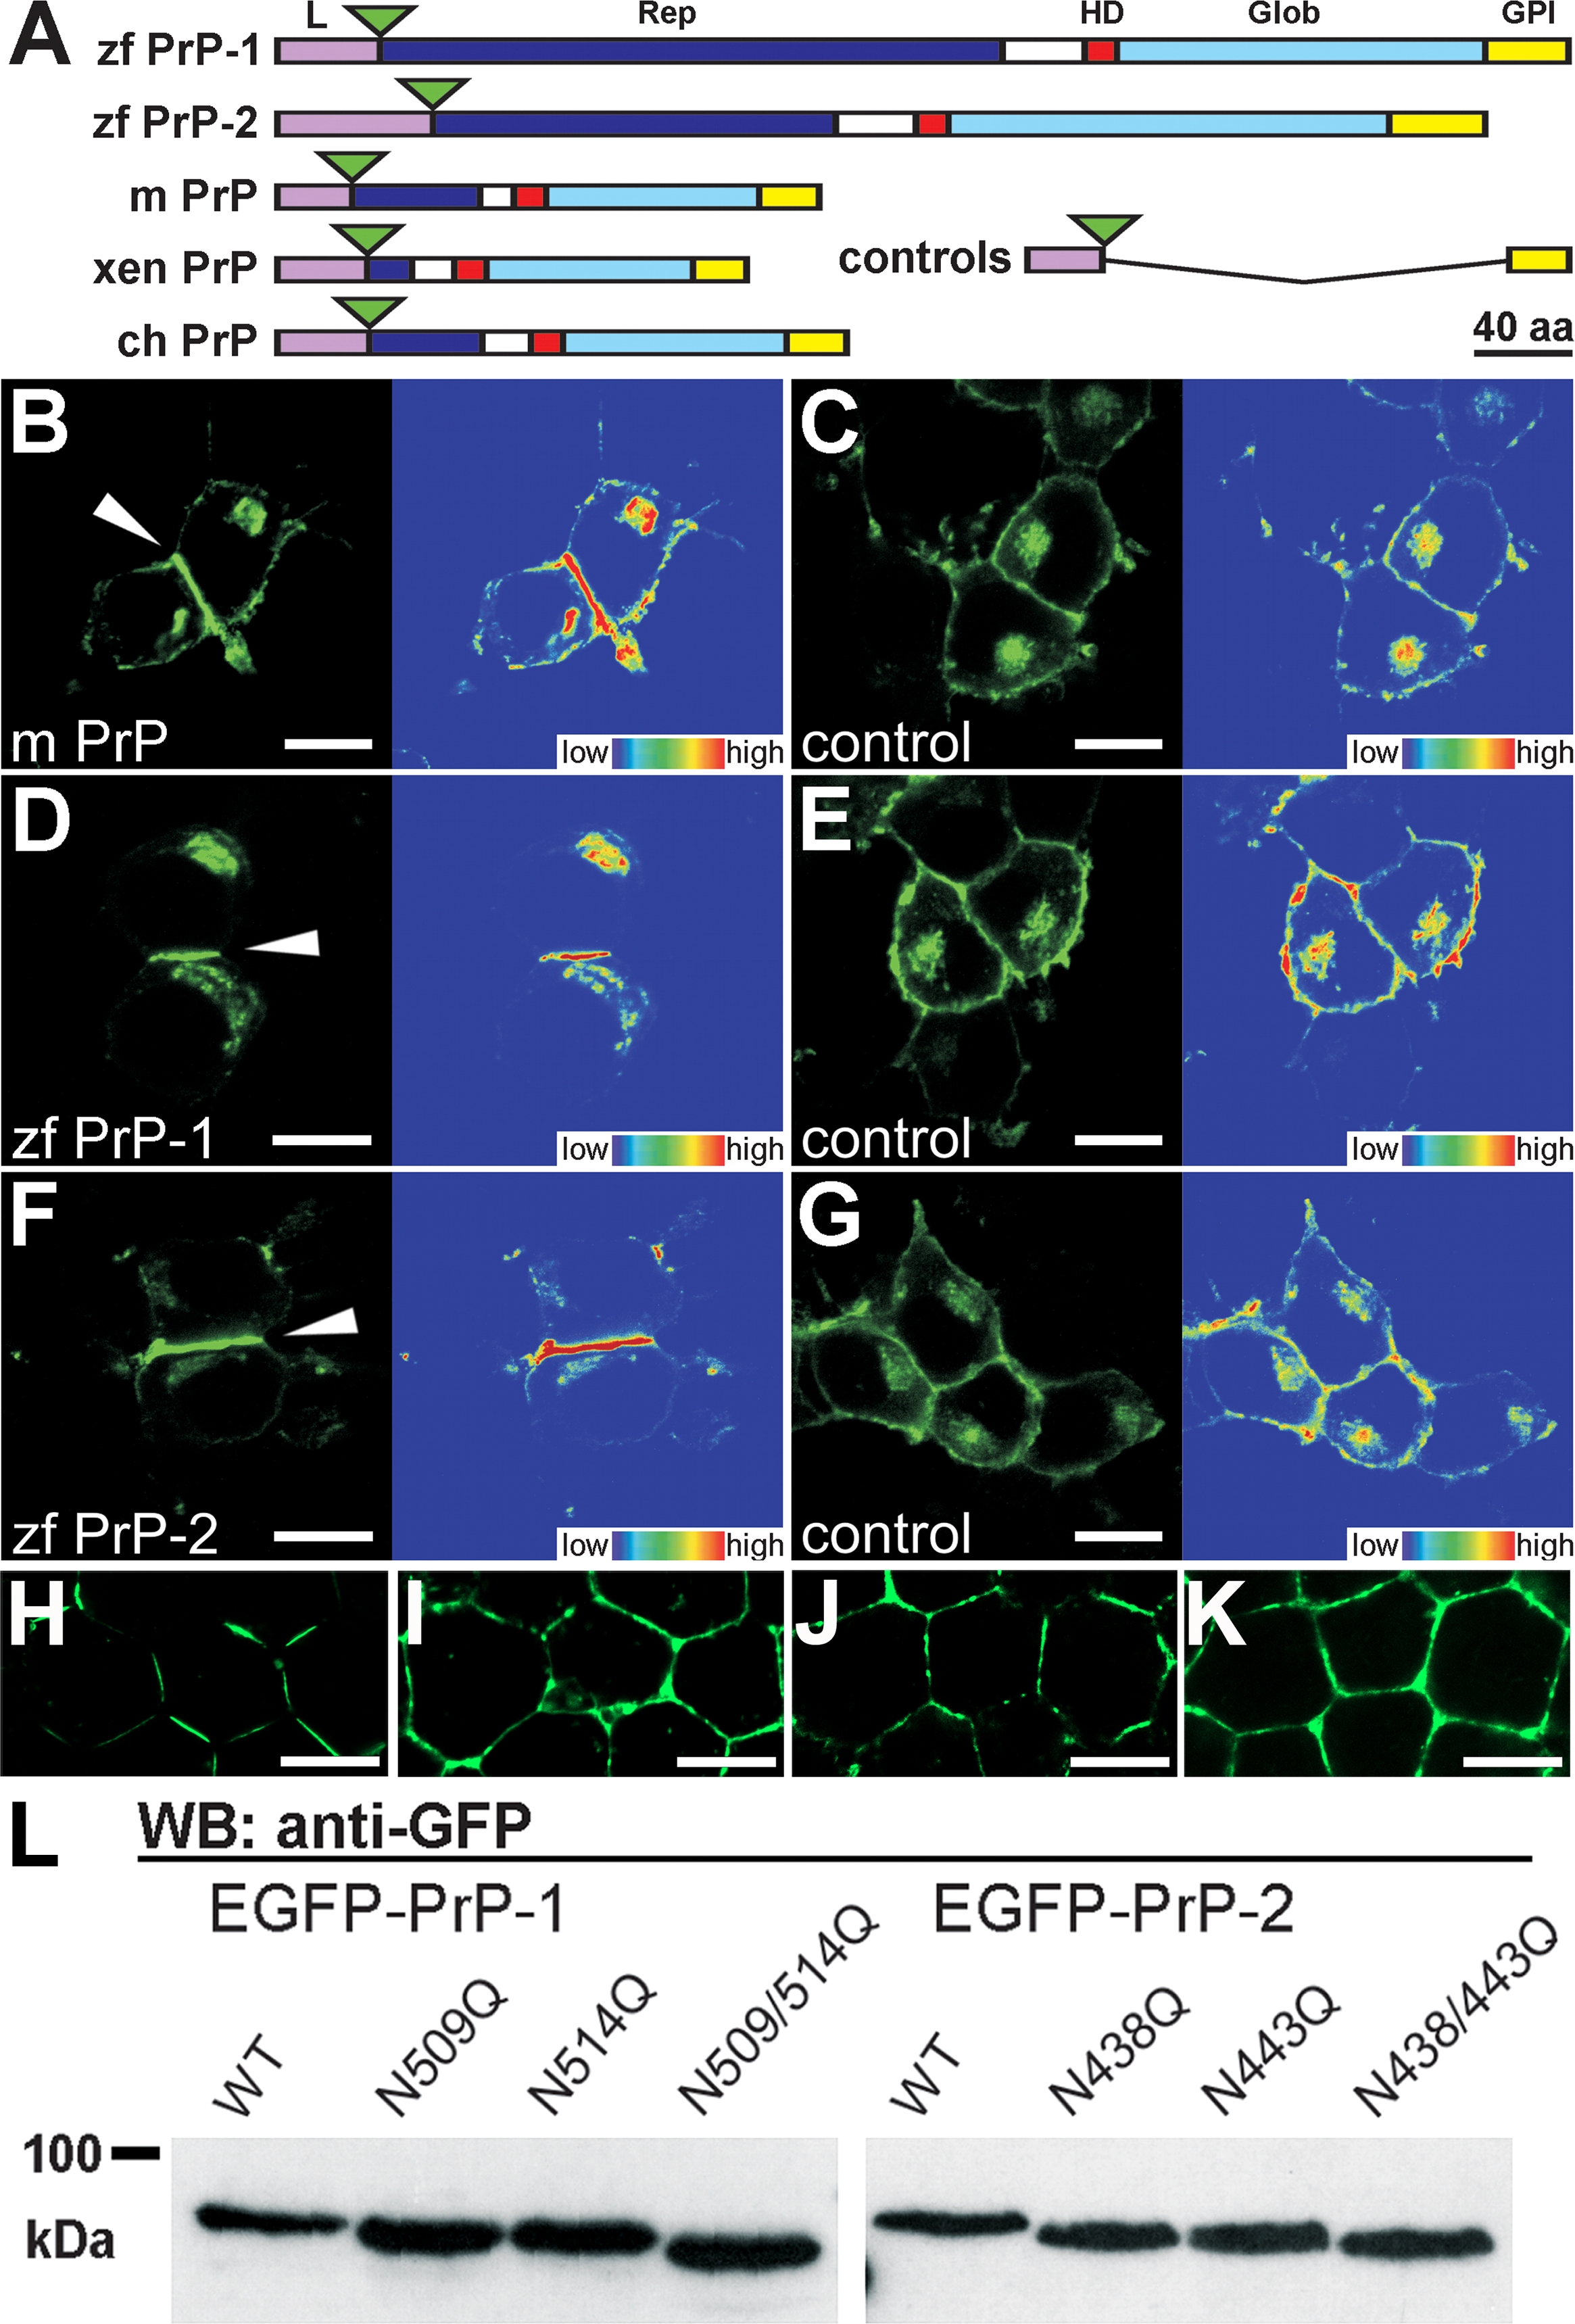
Fig. 3 Expression of EGFP-Tagged PrPs in N2a Cells and in Zebrafish Embryos
(A) EGFP fluorescent constructs used in this study: the major domains of zebrafish (zf PrP-1 and -2), mouse (m PrP), Xenopus (xen PrP), and chick (ch PrP) prion proteins are indicated: leader peptide (L) in violet, repetitive region (Rep) in blue, hydrophobic domain (HD) in red, globular domain (Glob) in light blue, and GPI-anchored peptide (GPI) in yellow. Fluorescence tags are represented as green triangles; control constructs (controls) lack PrP cores (Rep, HD, and Glob); domains are shown as previously defined [5].
(B, D, and F) N2a cells transfected with mouse PrP (B), zebrafish PrP-1 (D) and PrP-2 (F) constructs show local accumulation of the fusion proteins at cell–cell contacts (white arrowheads and fluorescence profiles, right).
(C, E, and G) The corresponding control EGFP fusion constructs are evenly distributed along the plasma membrane.
(H–K) For visualization of PrP expression in zebrafish deep cells, embryos were microinjected with zebrafish PrP-1 (H), PrP-2 (I), mouse PrP (J), and PrP-1 (control [K]) EGFP fusion RNAs and analyzed at the sphere stage (4 hpf).
(L) Predicted N-glycosylation sites of zf PrP-1 and -2 were confirmed by Western blot (WB) analysis (anti-GFP monoclonal antibody) of extracts from N2a cells transfected with the constructs indicated above each lane. WT, wild type.
(B–G) show EGFP fluorescence (left), and total fluorescence profiles (right); (H–J) show EGFP fluorescence and Nomarski overlays. Scale bars in (B–G) indicate 10 μm; scale bars in (H–J) indicate 5 μm.