
Fig. 5
- ID
- ZDB-IMAGE-090408-27
- Publication
- Málaga-Trillo et al., 2009 - Regulation of Embryonic Cell Adhesion by the Prion Protein
- All Figures
- Figures for Málaga-Trillo et al., 2009
|
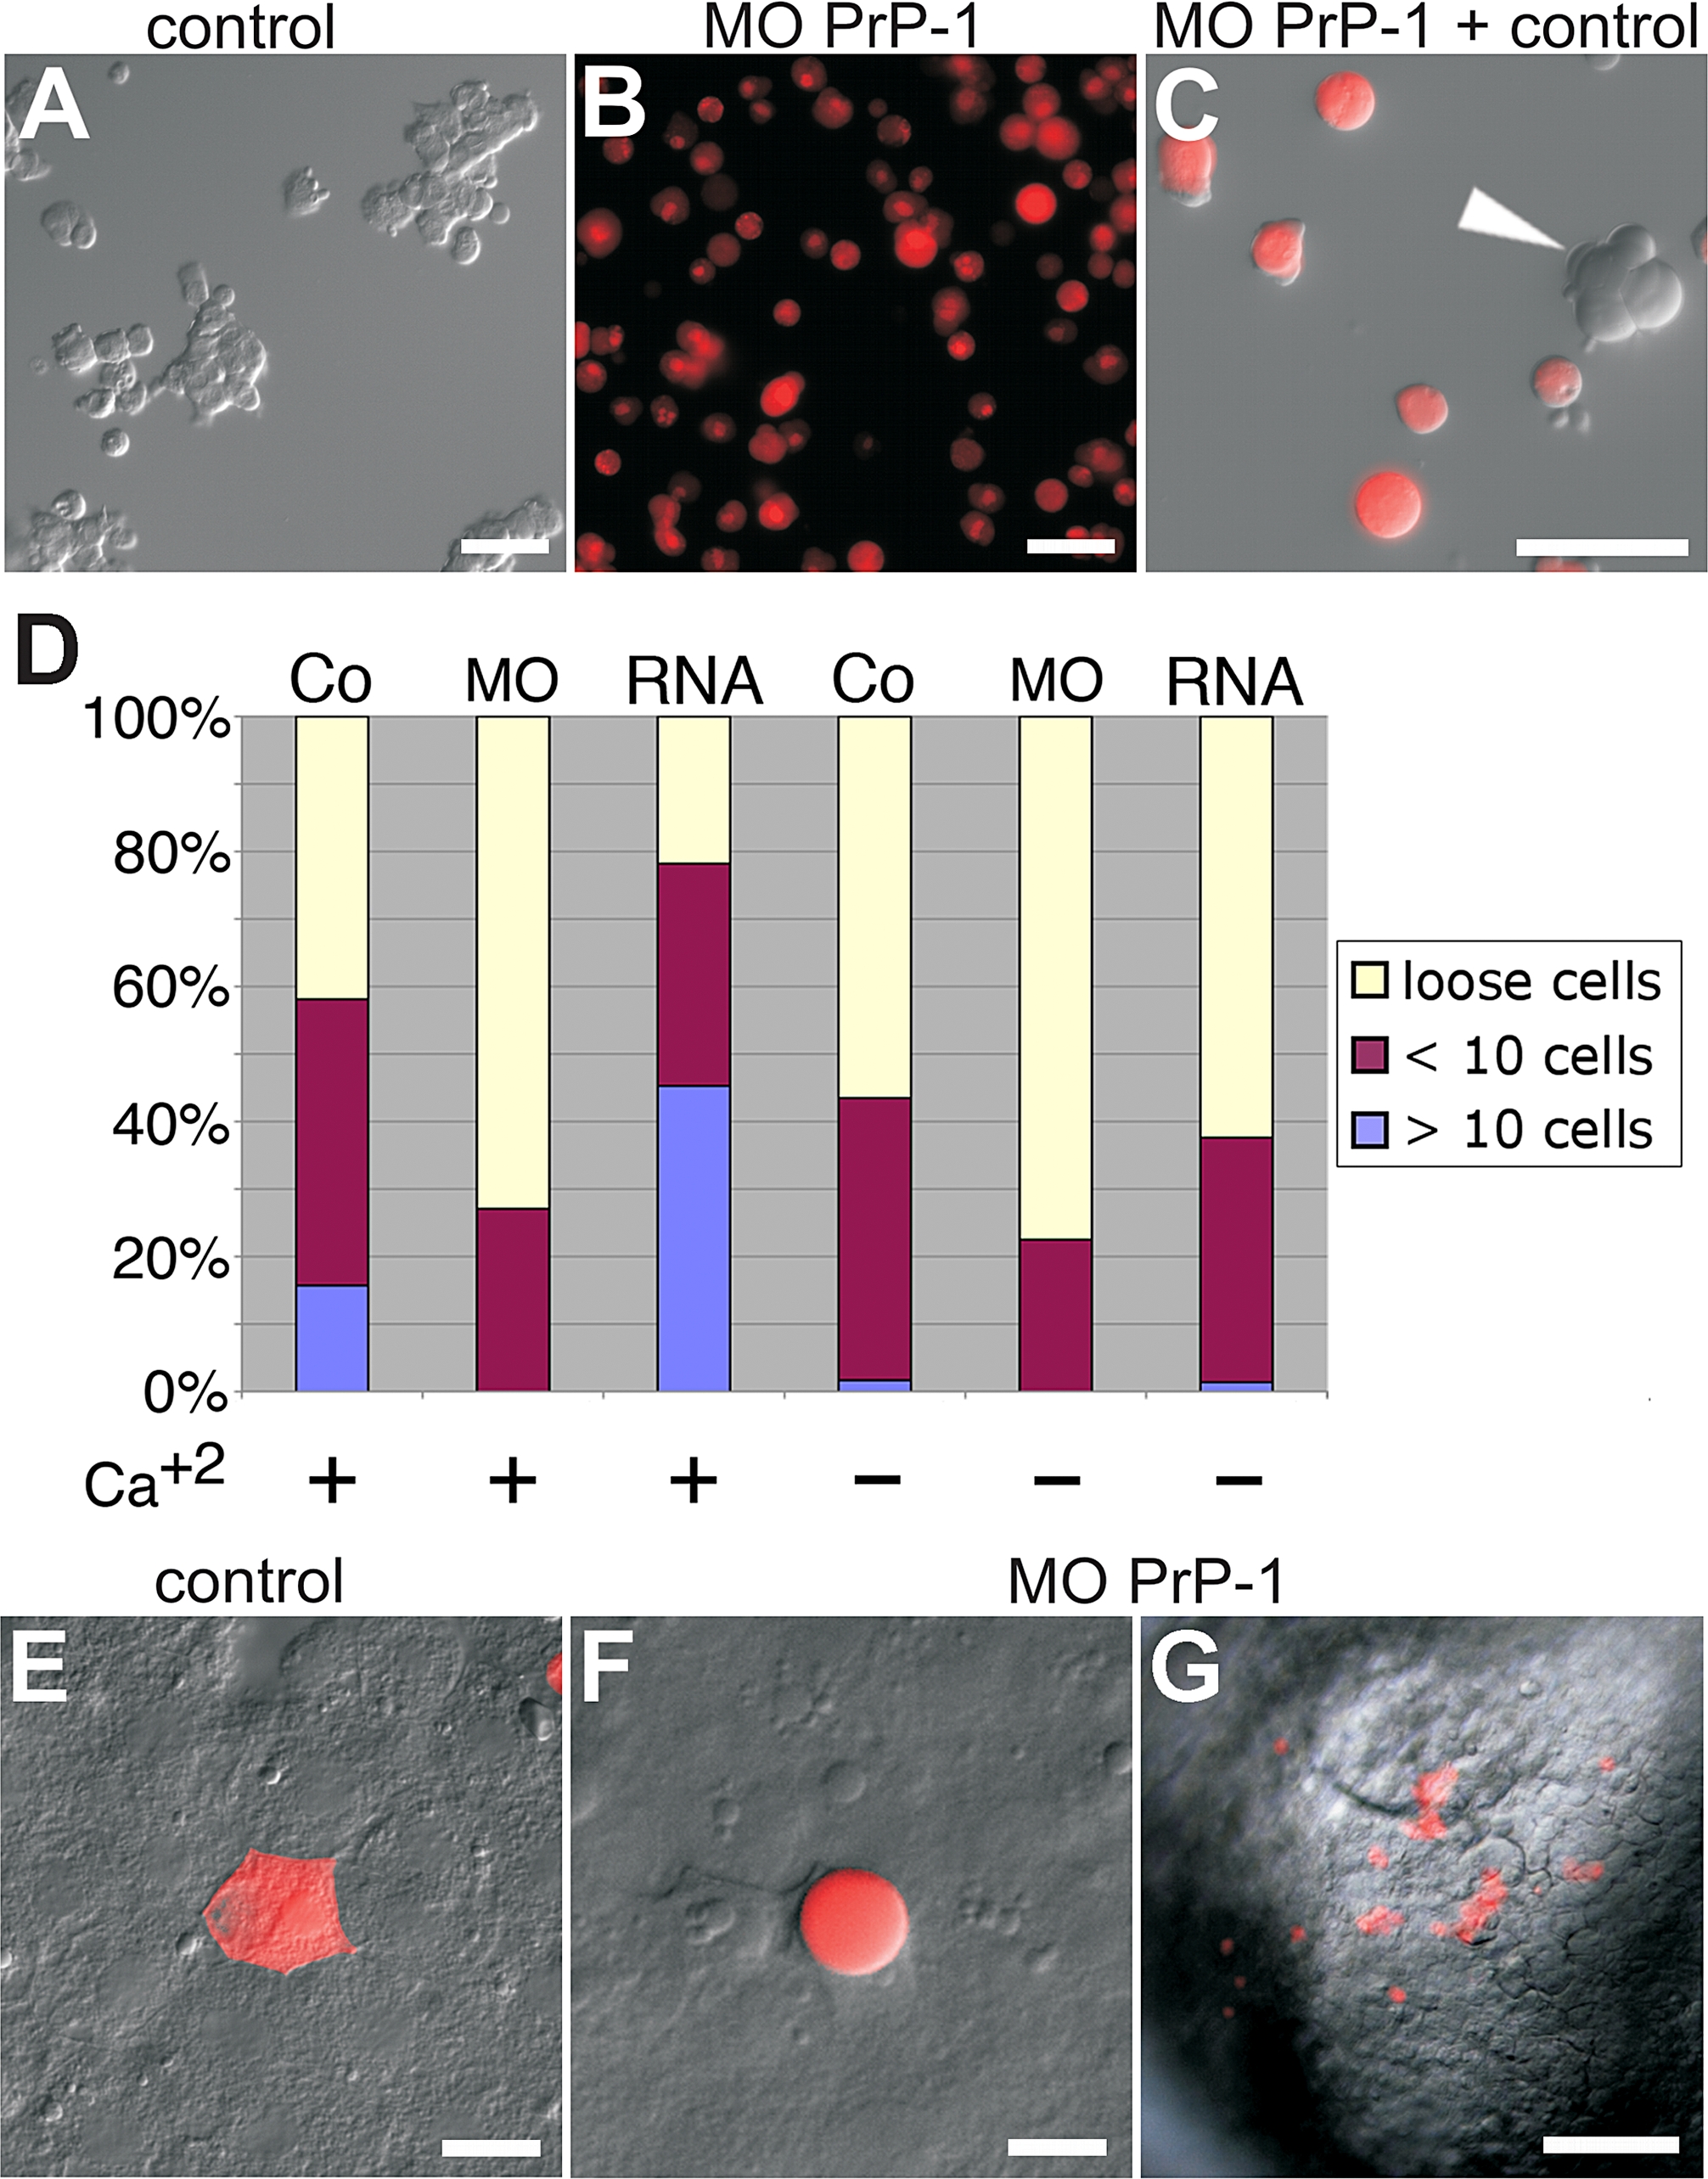
Fig. 5 Aggregation and Cell Transplantation Assays Using PrP-1 Morphant Blastomeres
Shield stage (6 hpf) embryos were dissociated to single cells, the cells were allowed to reaggregate in suspension for 45 min and were then plated out for analysis.
(A) Control embryos normally form small and large cell clusters.
(B) Aggregation is considerably reduced in PrP-1 morphant cells.
(C) When cocultured, PrP-1 morphant cells are generally excluded from control cell aggregates (white arrowhead).
(D) Quantitative differences in aggregation potential were observed between PrP-1 morphant, control, and PrP-1 overexpressing cells in the presence and absence of Ca+2; the bar graph displays the ratios of loose, small (<10 cells), and large (>10 cells) aggregates in control (Co) and PrP-1 morphant (MO) cells, 45 min after dissociation.
(E–G) Cell-autonomy of the PrP-1 defect was tested by embryonic cell transplantation: Labeled control deep cells (E) integrate into the control host tissue and resume polygonal shape. In contrast, PrP-1 morphant deep cells (F and G) fail to establish cell contacts with the control host cells. Adhesive properties were evaluated at 6 hpf, 2 h after transplantation.
Scale bars in (A–C, E, and F) indicate 20 μm; scale bar in (G) indicates 100 μm.