
Fig. S2
- ID
- ZDB-IMAGE-090408-33
- Publication
- Málaga-Trillo et al., 2009 - Regulation of Embryonic Cell Adhesion by the Prion Protein
- All Figures
- Figures for Málaga-Trillo et al., 2009
|
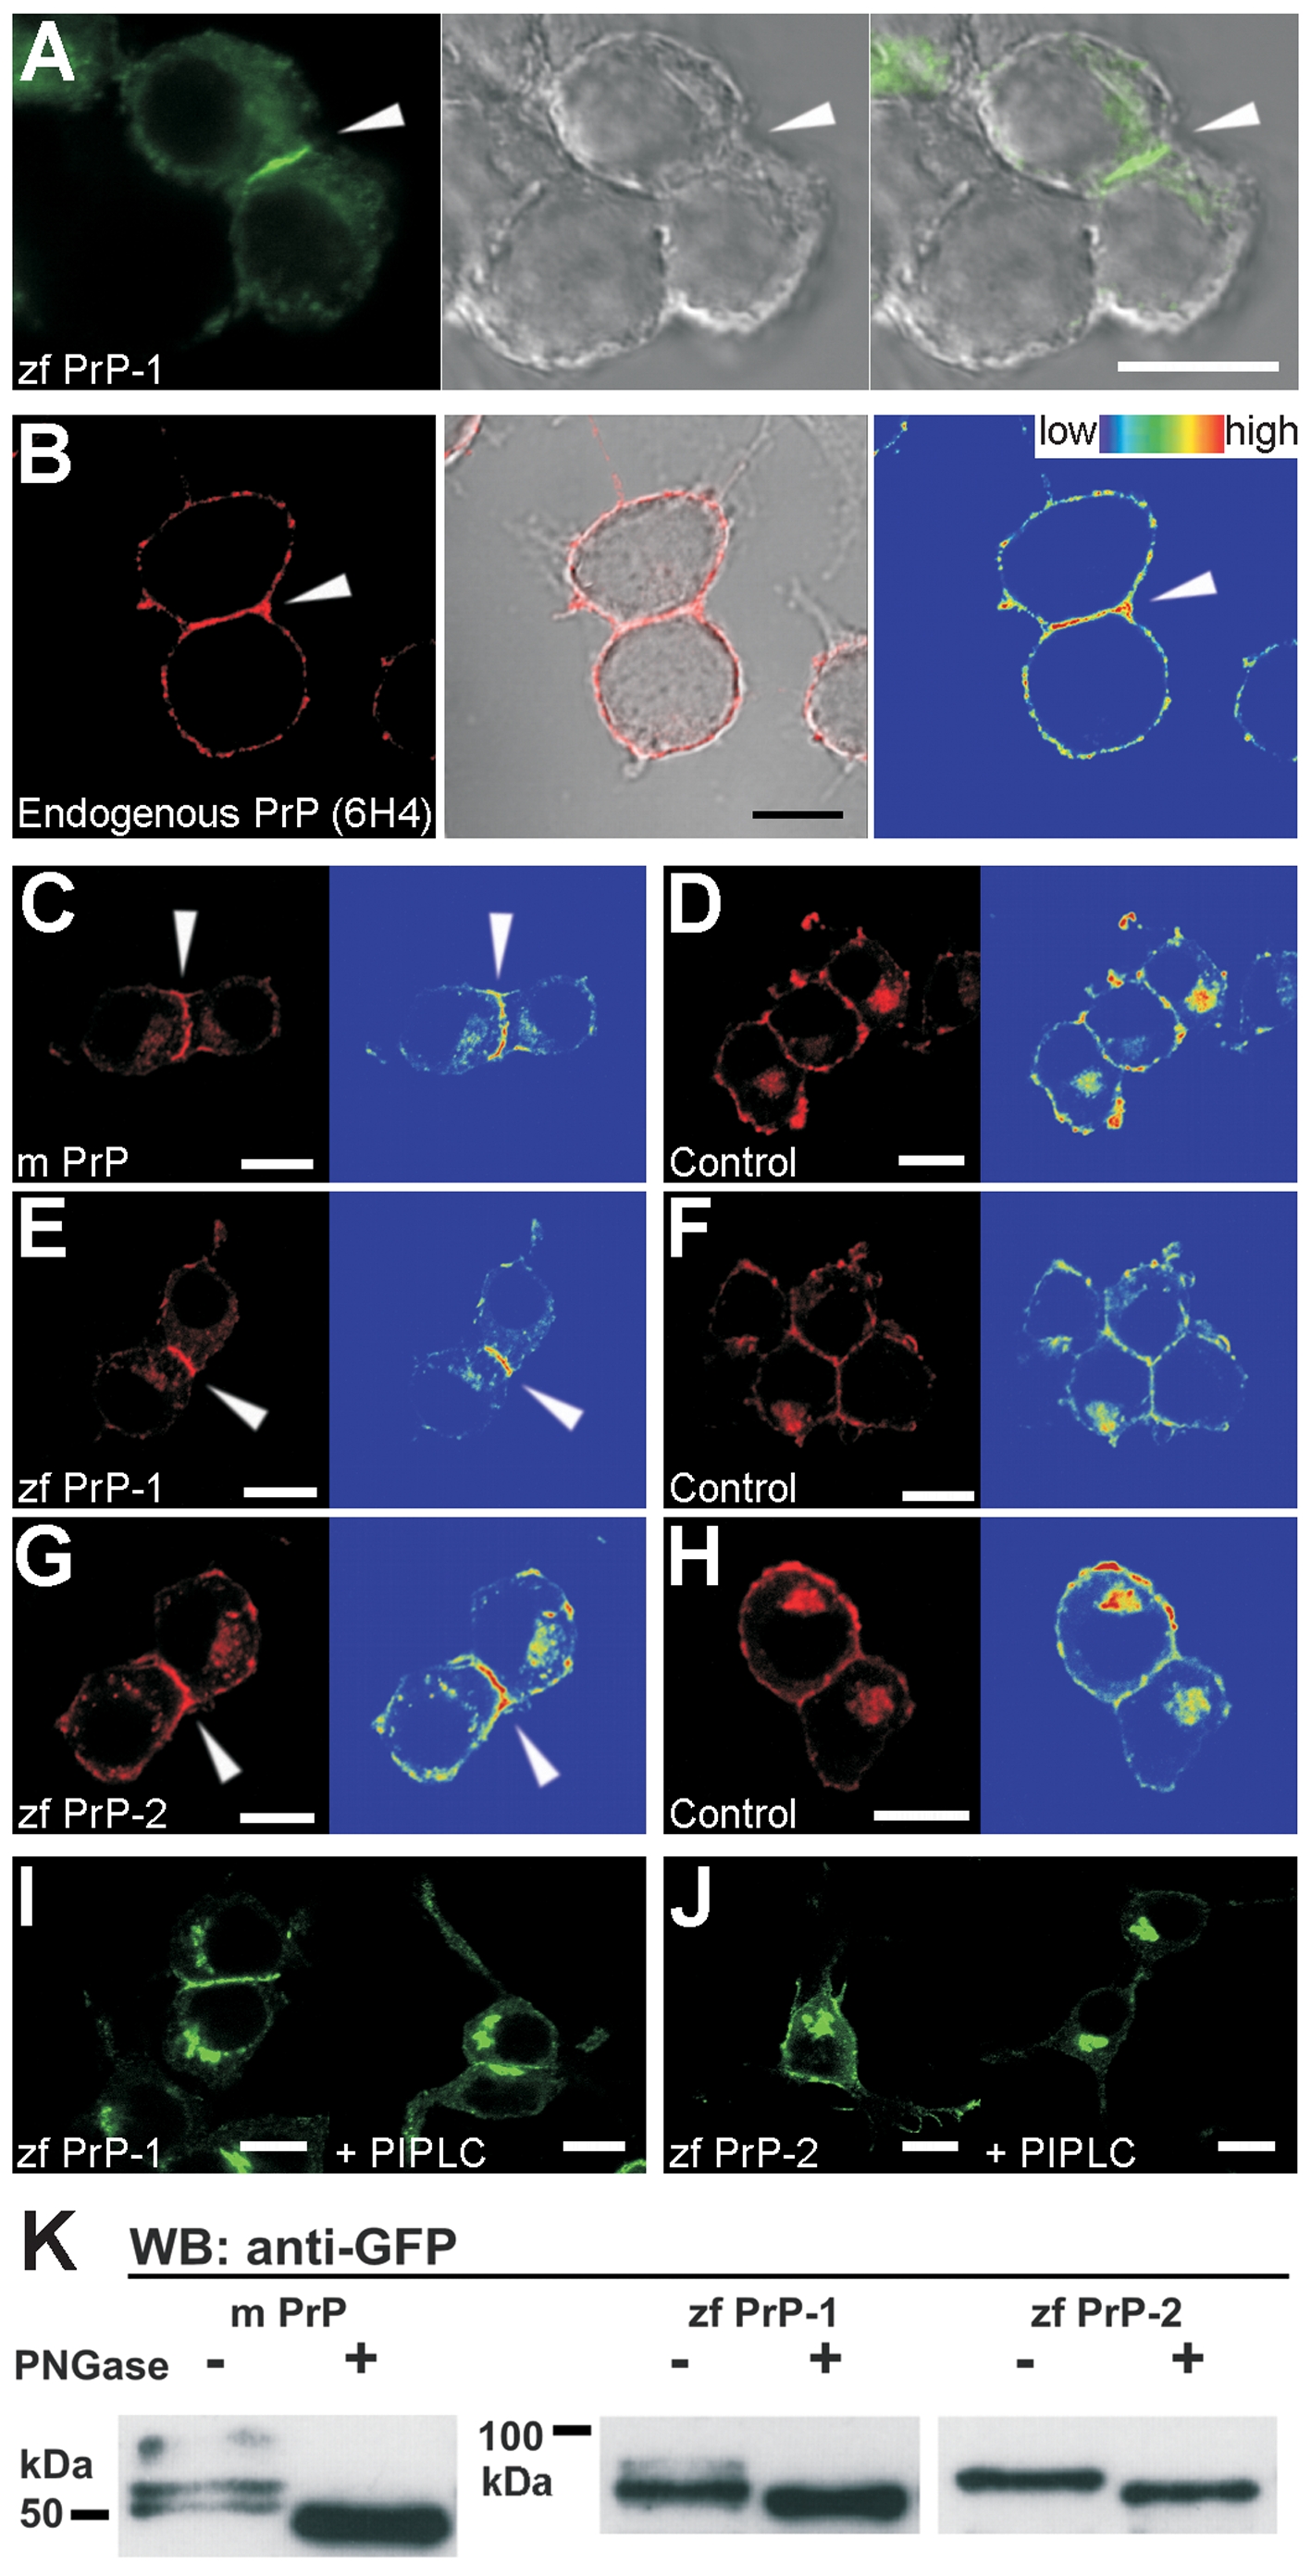
Fig. S2 Expression of Endogenous PrP, EGFP- and DsRed-Monomer–Tagged PrPs in N2a Cells
(A) Local accumulation of zebrafish PrP-1 (zf PrP-1) at a cell–cell contact (white arrowhead) is observed only when both cells forming the contact express the PrP construct.
(B) Immunostaining using the 6H4 monoclonal antibody against mouse PrP shows the plasma membrane localization and accumulation at cell contacts of the endogenous PrP in N2a cells ([B], arrowhead and total fluorescence profile).
(C, E, and G) Mouse PrP (m PrP) and zebrafish PrP-2 (zf PrP-2) DsRed-monomer fusion proteins localize at the plasma membrane and show accumulation at cell contacts ([C and G], arrowheads and total fluorescence profiles); zebrafish DsRed-monomer-PrP-1 (zf PrP-1) localize almost exclusively at contacts ([E], arrowhead and total fluorescence profile).
(D, F, and H) Accumulation of PrP at cell contacts is lost in DsRed-monomer constructs containing only the leader and GPI-anchor signals of m PrP (D), zf PrP-1 (F), and zf PrP-2 (H).
(I and J) Zebrafish EGFP-PrP-1 and -2 ([I and J], left panels) localize at the plasma membrane via a GPI anchor, as evidenced by phosphatidylinositol-specific phospholipase C (PI-PLC) treatment ([I and J], right panels).
(K) Western blot analysis using an anti-GFP monoclonal antibody of cell extracts incubated in the presence (+) or absence (-) of PNGase F reveals that m PrP, zf PrP-1, and zf PrP-2 EGFP fusion proteins are N-glycosylated in N2a cells.
Scale bars in (A–J) indicate 10 μm.