- Title
-
The tumor suppressor PRDM5 regulates Wnt signaling at early stages of zebrafish development
- Authors
- Meani, N., Pezzimenti, F., Deflorian, G., Mione, M., and Alcalay, M.
- Source
- Full text @ PLoS One
|
Gene expression profiling of a U2OS cell line overexpressing PRDM5. A. Western Blot analysis of PRDM5 protein expression in the U2OS-PRDM5 clone. PRDM5 protein level was analyzed 8, 24 and 48 hours after doxycycline treatment. U2OS cells bearing the empty vector (U2OS-pSG213) were used as control. HA-tagged PRDM5 was detected by immunoblot with an anti-HA antibody; anti-vinculin (anti-VCL) antibody was used for normalization of protein levels. B. Number of regulated Affymetrix probe sets identified by gene expression profiling at each time point. C–D. Expression level of PRDM5 target genes. Relative mRNA levels (logarithmic scale) of induced and repressed genes in U2OS cells after expression of PRDM5 for 8, 24 and 48 hours, as assayed by qPCR. A collection of PRDM5 target genes randomly selected (C) or of the wnt pathways (D) is shown. |
|
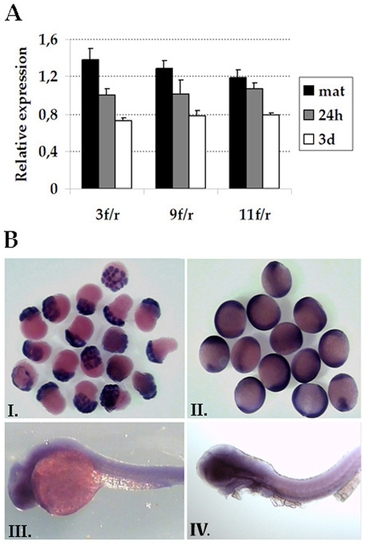
Expression of prdm5 during Zebrafish development. A. Expression of prdm5 was measured by qPCR using three pairs of primers (3f/r, 9f/r and 11f/r) that amplify different regions of the transcript. Relative expression levels at each developmental stage (2–8 cell stage = mat, 24 hours pf = 24h, 3days pf = 3d) were calculated with respect to the average expression levels in all samples. B. Whole mount in situ hybridization of 1 hpf (I), 9 hpf (II), 24 hpf (III) and 48 hpf (IV) zebrafish embryos stained with a cRNA dig-labeled prdm5 probe. Ubiquitously high expression levels are detected in the first two stages; lower levels are present in 24 and 48 hpf. EXPRESSION / LABELING:
|
|
Phenotypic analysis of Prdm5 functions in zebrafish development. A–F: Depletion of prdm5. Cyclopia and other axial mesendodermal defects in prdm5 morpholino injected zebrafish embryos. 48 hpf embryos either wild type (A,E) or injected (B: ATGmo; C: SBmo- 4ng; D: SBmo-8ng, F: Mix mo) are shown. Arrows in C, D and F point to mesendodermal defects. G–I: Overexpression of hPRDM5 rescues the morpholino phenotype. G: embryos injected with SBmo morpholino; H: Injections of 100 pg hPRDM5 mRNA in zebrafish embryos results in a “dorsalized” phenotype. I: Co-injection of prdm5 SBmo and hPRDM5 mRNA results in normal embryos. 48 hpf embryos are shown. J–L: Depletion of prdm5 enhances the mbl phenotype. Effect of prdm5 morpholino injection on the mbl phenotype. Injection of Mix mo in embryos derived from incrosses of mbl carriers. J) wt embryo; K) mbl homozygous mutants; L) mbl heterozygotes injected with Mix mo. All embryos analysed at 48 hpf. PHENOTYPE:
|
|
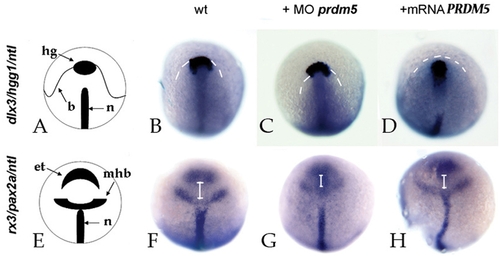
Analysis of CE movements at gastrulation. A, E = diagrams illustrating the staining pattern. B–D: Dorsal views of zebrafish embryos at 90% epiboly stage, stained for hgg1 (h = rostral mesendoderm), ntl (n = notochord), dlx3 (b = neural border). White dashed lines mark the dlx3 signal, and correspond to the border between neural and non-neural ectoderm. F-H: dorsal views of zebrafish embryos at 90% epiboly stage, stained for rx3 (e+t = eye field+telencephalon), pax2a (mhb = midhindbrain boundary) and ntl (n = notochord). The embryos were uninjected (B, F), injected with 6 ng SBmo (C, G) or 150 pg hPRDM5 mRNA (D, H). White lines mark the distance between eye field and mid-hindbrain boundary. EXPRESSION / LABELING:
PHENOTYPE:
|
|
Prdm5 regulates dkk1 expression in early zebrafish embryos. Expression of dkk1 at 30% epiboly (3 hpf) A, C, E and at 90% epiboly (6 hpf) B, D, F and insets I–III. A, C, E and upper panels of insets I–III are dorsal views (presumptive shield region to the right); B, D, F are lateral views (dorsal to the top). Lower panels of insets I–III show the tail region. A, B and inset I correspond to wt embryos, C, D and inset II to embryos depleted for prdm5 by injection of Mix mo and E, F and inset III to embryos injected with hPRDM5 mRNA. EXPRESSION / LABELING:
|

Unillustrated author statements EXPRESSION / LABELING:
|


