- Title
-
CREB activity modulates neural cell proliferation, midbrain-hindbrain organization and patterning in zebrafish
- Authors
- Dworkin, S., Heath, J.K., Dejong-Curtain, T.A., Hogan, B.M., Lieschke, G.J., Malaterre, J., Ramsay, R.G., and Mantamadiotis, T.
- Source
- Full text @ Dev. Biol.
|
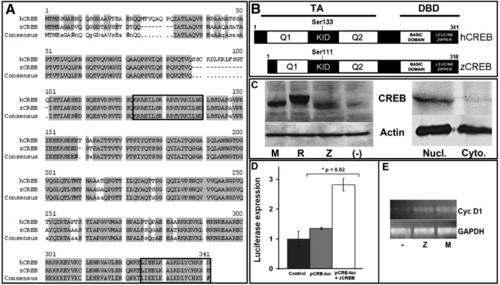
Characterization of zebrafish CREB (zCREB) structure and function shows significant homology to human CREB. (hCREB; A) Alignment of hCREB (Gen Bank Accession No. NM_004379) and zCREB (BC044436) amino acid sequences showing 88.7% sequence identity. Boxes highlight the conserved epitopes recognized by antibodies targeted against pCREB (“KRRE” domain; residues 123–139) or total CREB (“LKDL” domain; residues 326–341). (B) Predicted protein domain structure and alignment shows zCREB is a protein of 311 amino acids, with conserved key regulatory domains (TA, Trans-Activation Domain; KID, Kinase Inducible Domain; Q1/Q2, Glutamine Rich Regions; DBD, DNA-Binding Domain). (C) Immunoblotting of protein lysates extracted from HEK-293 cells transiently-transfected with cDNAs encoding full-length mouse CREB (mCREB; M) FLAG-tagged rat CREB (R), zCREB (Z) or vehicle negative control (-) with anti-CREB “LKDL” antibody showing detection of all three CREB protein species (actin shown as loading control). Additionally, immunoblotting of nuclear (nucl.) or cytoplasmic (cyto.) protein extracts from 24 hpf zebrafish embryos shows that zCREB is a nuclear protein. (D) Luciferase reporter assay using a CREB-responsive luciferase reporter plasmid (pCRE-Luc) showing increased luciferase activity following transfection of HEK-293 cells with zCREB. (E) Semi-quantitative RT-PCR following transfection of HEK-293 cells with mCREB (M), zCREB (Z) or vehicle negative control (-) showing increased mRNA abundance of the direct CREB target gene cyclin D1, relative to housekeeping gene GAPDH. EXPRESSION / LABELING:
|
|
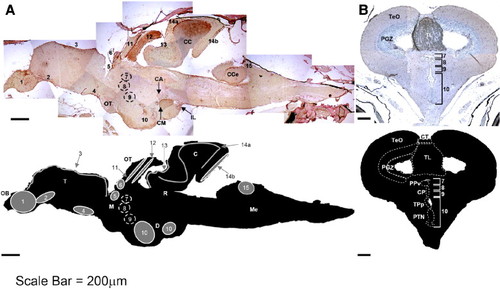
pCREB immunoreactivity in adult zebrafish brain is localized to cells of all known proliferative regions (sagittal (A) and coronal (B) sections). The sixteen known proliferation zones [PZ] in adult zebrafish brain are located within (rostral to caudal): [1] olfactory bulb, [2] ventral telencephalon, [3] dorsal telencephalon, [4] pre-optic area, [5] ventral thalamus, [6] habenula, [7] periventricular pretectal area, [8] dorsal thalamus, [9] posterior tuberculum, [10] hypothalamus, [11] optic tectum, [12] dorsal torus longitudinalis, [13] posterior mesencephalic lamina, [14a] molecular layer of cerebellum, [14b] cerebellar caudal lobe and [15] vagal lobe. An additional proliferation zone exists within the medulla oblongata, extending caudally into the spinal cord (not shown). Additional isolated pCREB+ cells are found in the optic tract (OT), and clusters of pCREB+ cells are present in the corpus cerebelli (CC), granular zone of cerebellum (C), crista cerebellaris (CCe), corpus mammilare (CM), commisura ansulata and oculomotor nerve (CA) and diffuse nucleus of the inferior lobe (IL; A), as well as in the periventricular grey zone (PGZ) and throughout the torus longitudinalis (TL) proper (B). Scale bar 200 µm; OB, olfactory bulb; T, telencephalon; M, mesencephalon; OT, optic tract; D, diencephalon; R, rhombencephalon; C, cerebellum; Me, medulla; TeO, optic tectum; CT, commisura tecti; PPv, ventral periventricular pretectal nucleus; CP, central posterior thalamic nuclei; TPp, periventricular nucleus of posterior tuberculum; PTN, posterior tuberal nucleus. EXPRESSION / LABELING:
|
|
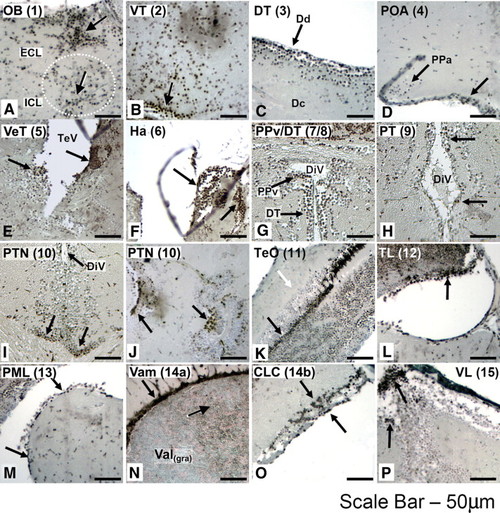
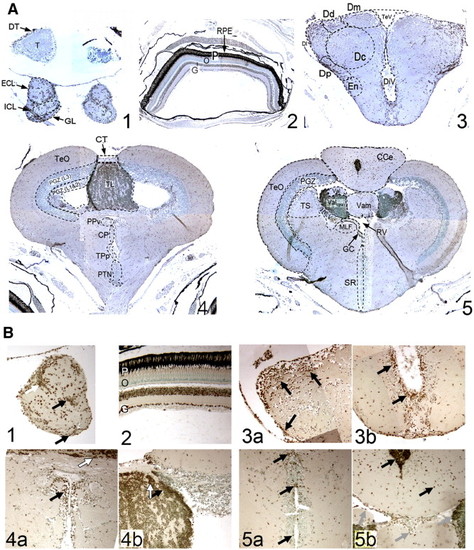
Discrete clusters of pCREB+ cells localize to all proliferative zones of the adult zebrafish brain. Within the olfactory bulb [PZ1; OB; A], strongest immunoreactivity is observed within the external cellular layer (ECL), close to the junction with the telencephalon (white arrow). Scattered positive cells are also widespread within the inner cellular layer (ICL) and glomerular cell layer (not shown). Isolated pCREB+ cells are present within the ventral telencephalon [PZ2; VT; B], with the strongest immunoreactivity towards the base of the telencephalon, near the junction of the OB. A tighter demarcation of pCREB+ cells within the dorsal telencephalon [PZ3; DT; C] exists, localized exclusively to the dorsal region (Dd), with very few pCREB+ cells within the telencephalon proper (Dc). Two discrete clusters of pCREB+ cells are visible within the ventral region of the pre-optic area (POA), including the anterior parvocellular pre-optic nuclei (arrows) [PZ4; POA; D]. Within the ventral thalamus [PZ5; VeT; E], two discrete clusters of cells, lining the walls of the telencephalic ventricle (TeV), are positive for pCREB, whereas in the more dorsally located habenula [PZ6; Ha; F], three discrete clusters of pCREB+ cells are visible (arrows). Four proliferation zones are present lining the walls of the diencephalic ventricles (DiV) the periventricular pretectal nuclei [PZ7; PPv; G], dorsal thalamus [PZ8; DT; G], posterior tuberculum [PZ9; PT; H]; and the posterior tuberculum, located within the hypothalamus [PZ10; PTN; I (coronal)–J (sagittal)]. Within the optic tectum [PZ11; TeO; K] a tight band of pCREB+ cells is visible within the periventricular grey zone (PGZ), layers 1 and 2 (black arrow), whereas most cells within the TeO layer 3 are negative for pCREB (white arrow). Within the torus longitudinalis [PZ12; TL; L], most cells are pCREB+ (black arrow), excluding a discrete area of the ventral TL, although the ventral-most TL cells are all strongly positive for pCREB. All cells of the posterior mesencephalic lamina [PZ13; PML; M] are positive for pCREB, as are cells within the molecular layer of the valvula cerebelli [PZ14a; Vam; N]. Additionally, pCREB+ cells reside in the granular layer (white arrow), and in the cerebellar caudal lobe [PZ14b; CLC; O]. Within the vagal lobe [PZ15; VL; P], a cluster of pCREB+ cells is visible in the dorsal-most region (black arrow). Planes of section: sagittal (A–F, J–P) coronal (G–I). Scale bar 50 μm. EXPRESSION / LABELING:
|
|
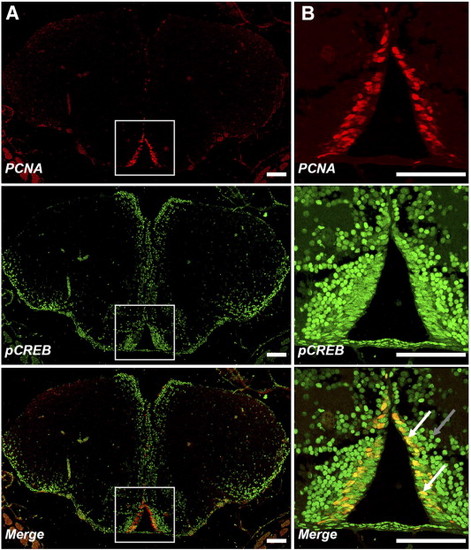
Proliferating neural cells express pCREB. Double-labelling immunofluorescence shows actively-proliferating cells in PZ2 are pCREB+. Coronal sections of adult zebrafish anterior telencephalon double-stained for PCNA (red) and pCREB (green) show most PCNA + cells lining the walls of the ventral diencephalic ventricles are pCREB+ (white box; x100 A and x400; B). Additional pCREB+ cells extending laterally into the telencephalon correspond to regions of migrating neuroblasts. Note differences in morphology between flattened, elongated pCREB+/PCNA + cells adjacent to the ventricular wall (white arrows) compared to smaller, round pCREB+/PCNA- cells (grey arrow) which have migrated tangentially into the telencephalon proper from the ventricular proliferation zone. EXPRESSION / LABELING:
|
|
Zebrafish embryonic development is altered following perturbation of CREB activity. Single cell embryos injected with 75–125 pg synthetic, capped mRNA encoding full-length constitutively active CREB-FY or dominant negative CREB-M1 show severe developmental defects, compared with control lacZ RNA-injected embryos (A). Embryos injected with CREB-FY or CREB-M1 mRNAs (B) show curvature of anterior–posterior axis, (black arrows) decreased axis length from otic vesicle to tail (bar), severe disruption of neural patterning, microcephaly and eye development (**) and somite shape and spacing (s). Darkfield imaging (C) highlights specific neural structural disorganization (band) in both CREB-FY and CREB-M1 injected fish, compared with lacZ control. Dorsal views of CREB-FY and CREB-M1 injected fish (D) show specific disruption of the midbrain/hindbrain boundary (MHB; boxes) relative to control. (E) The structure of the CREB constructs used for injections, showing the N-terminal glutamine-rich transactivation domains (Q1 and Q2) surrounding the kinase-inducible domain (KID) harboring the serine-133 residue mutated to alanine in CREB-M1; CREB-FY has the tyrosine-134 residue mutated to phenylalanine. The C-terminal basic-domain has the DNA-binding interface and the leucine-zipper region has the dimerization interface. (F) Immunodetection of the marker of proliferation, PCNA in the midbrains of 24 hpf injected embryos shows an increased abundance and distribution of PCNA positive cells in the brains of CREB-FY injected embryos (black arrows) when compared to LacZ controls, which display an ordered, regular pattern of PCNA expression (white arrows), lining the walls of the diencephalic ventricles. CREB-M1 injected embryos display a decrease in the number of PCNA positive cells, although the WT pattern of expression is retained (blue arrows). Automated morphometric quantitation (METAMORPH) analysis (G) shows a significant difference between the number of PCNA positive cells in the embryonic midbrain of CREB-FY and CREB-M1 injected embryos relative to controls (n = 10 for CREB-FY and CREB-M1, n = 8 for lacZ control; *p < 0.05, ***p < 0.001 using the unpaired t-test). |
|
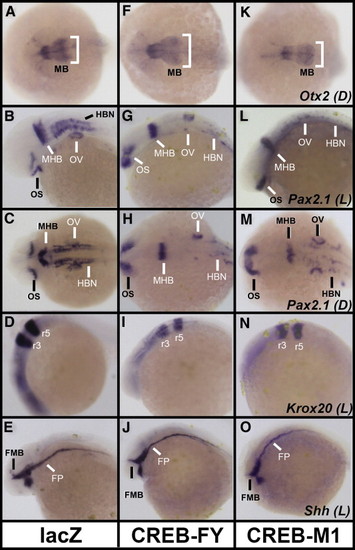
Expression of neural patterning genes is disrupted in zebrafish embryos with perturbed CREB function. 24 hpf zebrafish injected with 75–125 pg lacZ control (A–E), CREB-FY (F–J) or CREB-M1 (K–O) capped mRNA were stained by wholemount in-situ hybridization (WISH) for patterning markers of the midbrain (Otx2; A, F, K), midbrain–hindbrain boundary (Pax2.1; B–C, G–H, L–M), hindbrain rhombomeres (Krox20; D, I, N) and floor-plate (Shh; E, J, O). Otx2 expression in the midbrain (MB) is decreased in CREB-M1 injected embryos (compare K with A), but no increase is visible in the majority of CREB-FY injected embryos (compare F with A) relative to controls. The midbrain-specific localization of Otx2 is unchanged. Expression of Pax2.1 in isthmic organizer cells of the midbrain–hindbrain boundary (MHB) is unchanged, although a decrease in Pax2.1 is observed in the hindbrain neurons (HBN) of most CREB-FY (G, H) and CREB-M1 (L, M) injected fish relative to controls (B, C). Pax2.1 expression in the optic stalk (OS) and otic vesicle precursors (OV) is largely unchanged. Krox20 expression in rhombomeres 3 and 5 of both CREB-FY (I) and CREB-M1 (N) injected embryos is unchanged compared to controls (D). Shh mRNA (E, J, O) localizes to the floor plate neural organizer (FP) and the forebrain/midbrain boundary in the developing diencephalon (FMB). Both CREB-FY (J) and CREB-M1 (O) injected embryos show minor disruption of the floor plate, relative to lacZ injected controls (E), although the specific localization and distribution of cells along the anterior–posterior axis remains unaltered. The distribution of Shh demarcating the forebrain/midbrain boundary is largely unchanged in CREB-FY or CREB-M1 injected mutants relative to controls. Orientation is shown in either lateral (L) or dorsal (D) views; anterior in all pictures is to the left. EXPRESSION / LABELING:
|
|
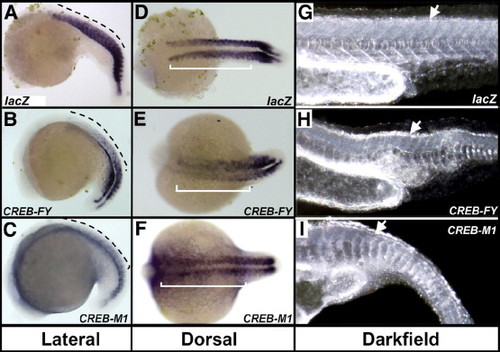
Distribution of myoD RNA in the trunk and tail of injected embryos is disrupted in embryos with perturbed CREB function. Embryos injected with lacZ (A, D), CREB-FY (B, E) or CREB-M1 (C, F) were stained by WISH during late somitogenesis (22–24 somite stage). CREB-FY injected embryos exhibit less MyoD staining in the trunk somites, 1–15, (dashed line, B; bar, E) than do CREB-M1 (C, F) or control (A, D) embryos. MyoD staining in the posterior-most 7–9 (tail) somites is relatively unchanged. Darkfield microscopy shows somite morphogenesis (arrows, G–I) is varyingly disrupted in both CREB-FY (H) and CREB M1 (I) injected embryos relative to controls (G), which display regularly-spaced, chevron-shaped somites. CREB-FY injected fish display irregularly spaced and sized somites, although the basic chevron-shape is retained (H). CREB-M1 injected fish show additional loss of somite structure and shape (I; note U-shaped somites). EXPRESSION / LABELING:
|
|
Immunohistochemical staining of coronal brain sections of adult zebrafish brains shows pCREB+ cells are localized within discrete regions in the olfactory bulb (OB; A-i and B-i), retina (A-ii and B-ii), anterior forebrain (telencephalon; A-iii and B-iii), midbrain (mesencephalon/diencephalon A-iv and B-iv) and hindbrain (cerebellum/ rhombencephalon; A-v and B-v; Magnification A1–5: × 10 and B1–5: × 40). Within the OB (A-i and B-i), pCREB+ cells are observed throughout the layers, as seen in sagittal sections, with a strong concentration at the junction of the ECL and ICL (Bi; white arrow). Within the neurally-derived layers of the retina (A-ii and B-ii), strong immunoreactivity for pCREB is observed in the ganglion cell layer (G), and most cells of the inner nuclear layer (I). As in higher vertebrates, no pCREB+ cells are visible in either the outer nuclear layer (O) or the nuclei of the rod and cone photoreceptors (P). EXPRESSION / LABELING:
|
|
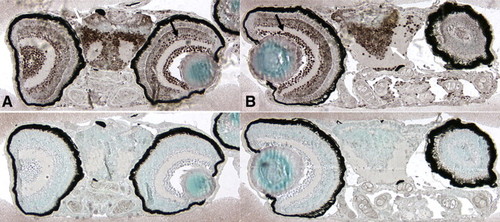
Expression of pCREB in early embryonic brain. pCREB is expressed in many cells of the developing embryos (two WT embryos are shown A–B), including cells of both neural hemispheres (white arrows) as well as the inner and outer nuclear layers of the retina (black arrows). EXPRESSION / LABELING:
|

Unillustrated author statements EXPRESSION / LABELING:
|
Reprinted from Developmental Biology, 307(1), Dworkin, S., Heath, J.K., Dejong-Curtain, T.A., Hogan, B.M., Lieschke, G.J., Malaterre, J., Ramsay, R.G., and Mantamadiotis, T., CREB activity modulates neural cell proliferation, midbrain-hindbrain organization and patterning in zebrafish, 127-141, Copyright (2007) with permission from Elsevier. Full text @ Dev. Biol.

