
- Title
-
A role for foxd3 and sox10 in the differentiation of gonadotropin-releasing hormone (GnRH) cells in the zebrafish Danio rerio
- Authors
- Whitlock, K.E., Smith, K.M., Kim, H., and Harden, M.V.
- Source
- Full text @ Development

Cranial neural crest domains in the developing zebrafish embryo. (A,B) Pattern of sox10 (A) and foxd3 (B) gene expression in 4- to 6-somite stage embryos (dorsal views). (C) The locations of the pre-migratory neural crest (purple) and placode (red) domains. Asterisks in A, B and C indicate the anterior limit of cranial neural crest domain. (D) Lateral view of a zebrafish head depicting the migratory routes of cranial neural crest (purple). Cranial neural crest cells migrating dorsal to the eye will contribute to the terminal nerve (TN) GnRH cells (E, purple) adjacent to the developing olfactory (olf) organ, and those migrating posterior to the eye may give rise to the midbrain (MB) GnRH cells (E, purple). Hypothalmic GnRH cells are indicated in orange (E). Scale bar in A: 100 µm for A,B. EXPRESSION / LABELING:
|
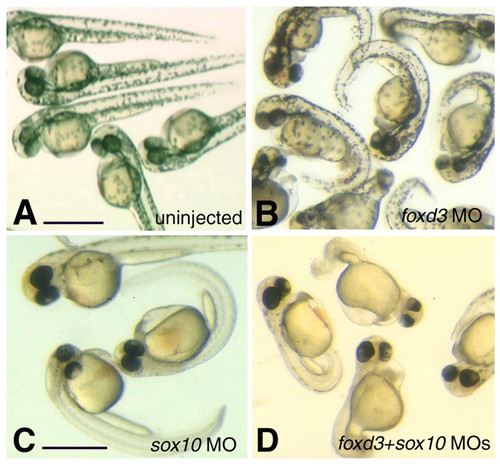
Morphological phenotypes resulting from the knockdown of genes important in neural crest development. Live zebrafish embryos at 40 hpf showing uninjected controls (A), and morpholino-induced knockdown phenotypes for foxd3 (B), sox10 (C) and foxd3+sox10 (D) genes. (B) foxd3 morphant animals had pigment, but a slightly smaller head than controls and a ventrally curled tail. (C) sox10 morphant animals had no pigment [as previously reported (see, Dutton et al., 2001b)], and occasionally a slight ventral curl to the tail. (D) foxd3+sox10 morphant animals had no pigment and a ventrally curled tail. Scale bar: A-D, 1 µm. PHENOTYPE:
|
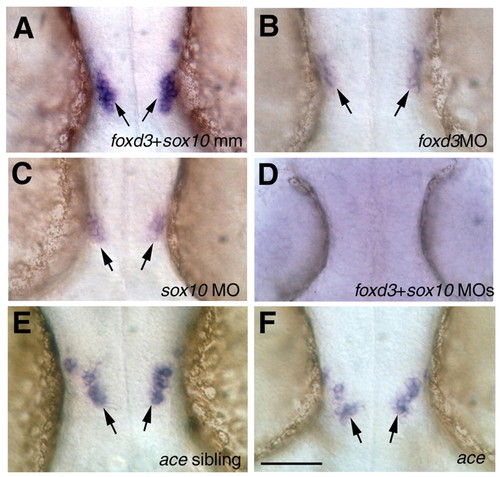
Role of foxd3, sox10 and fgf8 in the development of midbrain gnrh2 cells. Dorsal views of whole-mount preparations, showing gnrh2 expression in the head of embryos at 35α1 hpf. (A-D) The effects of knockdown of foxd3 and sox10. (A) foxd3+sox10 mismatch control embryos, showing a normal complement of gnrh2 cells (arrows) (Gopinath et al., 2004. foxd3 (B) and sox10 (C) morphant animals showed significantly fewer gnrh2 cells than did mismatch control embryos (A), whereas animals injected with both foxd3 and sox10 MOs (D) showed a complete loss of gnrh2 cells (see Table 1). (E,F) Role of fgf8 in gnrh2 development. (E) Expression of gnrh2 in an ace non-mutant sibling control. (F) ace mutant embryo showing the normal number of gnrh2-expressing cells (see Table 1). Scale bar: 100 µm. EXPRESSION / LABELING:
|
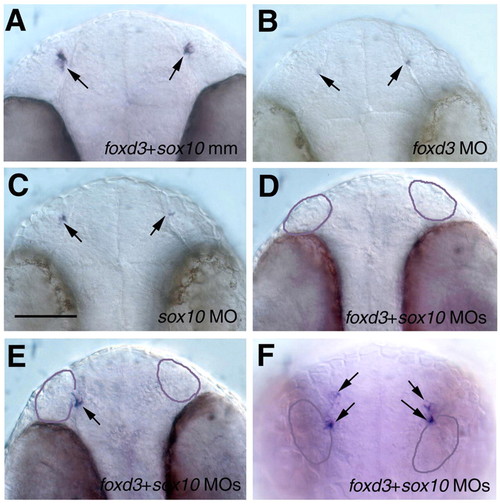
Role of foxd3 and sox10 in the development of gnrh3 cells in the terminal nerve. Whole mounts showing gnrh3 expression (arrows) at 35±1 hpf in foxd3+sox10 mismatch control (A), foxd3 MO (B), sox10 MO (C) and foxd3+sox10 MO (D-F) morphant animals. Knockdown of either gene, or of both genes together, caused a significant decrease in the number of cells expressing GnRH3 (see Table 1). Knockdown of both Foxd3 and Sox10 proteins resulted in a total loss of gnrh3 cells (D), or a partial loss of gnrh3 cells either associated with the olfactory placode (E, arrow), or displaced dorsally (F, arrows). Purple outline indicates the olfactory placodes. (A-E) Ventral views with anterior at the top; (F) frontal view with dorsal at the top. Scale bar: 80 µm. EXPRESSION / LABELING:
|

otx2, fgf8 and six4.1 genes are expressed in a normal spatio-temporal pattern in the foxd3+sox10 morphant embryos. (A-D) Uninjected embryos showing the pattern of otx2 (A,B), fgf8 (C) and six 4.1 (D) gene expression at 35±1 hpf. (E-H) Corresponding pattern of gene expression of otx2 (E,F), fgf8 (G) and six 4.1 (H) in foxd3+sox10 morphant embryos at 35±1 hpf. (A,E) Lateral views with MHB gene expression (arrow), and pigment cells in the uninjected animals (A, arrowhead). (B,F) Dorsal view showing otx2 expression in the midbrain; asterisks indicate the approximate location of the gnrh2 cells at this stage of development. (C,G) Dorsal views showing that fgf8 expression (arrows) is maintained at the MHB. (D,H) Ventral view of olfactory organs (arrows) expressing six4.1; asterisks indicate where the gnrh3 cells would be found at this stage of development. Scale bars: 100 µm in A,E; 50 µm in B,C,F,G; 100 µm in D,H. EXPRESSION / LABELING:
|

Co-localization of sox10-GFP and gnrh2 expression in the developing midbrain. (A) The expression sox10 is maintained in a small cluster of cells (arrows) at the backside of the developing optic cup at 18 hpf. (B) The GFP protein, recognized with an anti-GFP antibody at 26 hpf (arrows), reflects the earlier expression of sox10. (C) Differentiating gnrh2 cells (arrows) are found in the same region as the sox10-GFP immunoreactivity (see B). (D) gnrh2-expressing cells (purple, arrowhead) lie in the lateral neural tube, and in a subset of these cells the in situ signal (purple) co-localizes with the sox10-GFP immunoreactivity (purple+brown, arrowhead). Scale bars: A, 100 µm; B,C, 100 µm; D, 20 µm. EXPRESSION / LABELING:
|
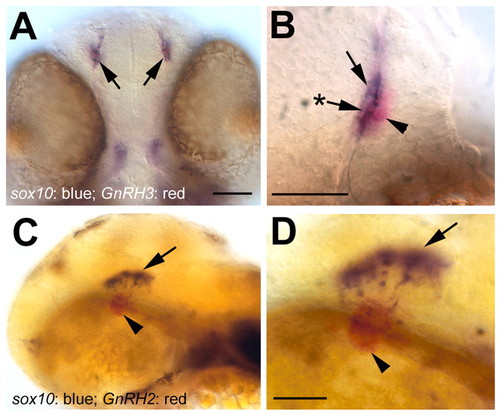
Onset of sox10 expression in the terminal nerve and midbrain at 48 hpf. (A) Ventral view showing sox10 expression in the terminal nerve (blue, arrows). (B) Higher magnification view of the terminal nerve on one side, showing gnrh3-positive cells (arrowhead, red), sox10-positive cells (arrow, blue), and cells apparently labeled for sox10 and gnrh3 (arrow with asterisk). (C) Lateral view showing sox10 (blue, arrow) and gnrh2 (red, arrowhead) expression in the midbrain. (D) Higher magnification view of the gnrh2-positive cells (arrowhead, red) and sox10-positive cells (arrow, blue); there is no co-localization of sox10 and gnrh2 at this stage in development. Scale bars: A,C, 50 µm; B,D, 40 µm. EXPRESSION / LABELING:
|

Role of foxd3, sox10 and kal1.1 in the development of GnRH cells. (A) Normal pattern of gnrh3 expression in cells of the terminal nerve (arrowheads). (B) gnrh3 cells were present in normal numbers in kal1.1 morphants, but could be disorganized; arrowhead with asterisk indicates gnrh3 cells displaced dorsally. (C,D) gnrh2 cells (arrows) were present in normal numbers in kal1.1 morphants. (E-H) Effects of foxd3+sox10 and kal1.1 knockdown on the development of hypothalamic GnRH, visualized using a pantropic anti-GnRH antibody. (E) Normal pattern of GnRH-IR showing hypothalamic GnRH cells (arrows) extending back to the post-optic commissure (asterisk), and terminal nerve GnRH3 cells (arrowheads). (F) Presence of GnRH cells of the hypothalamus (arrows) was not affected by knockdown of foxd3 and sox10, but these cells were clustered near the region of the post-optic commissure (asterisk). (G) Normal pattern of GnRH immunoreactivity obtained in kal1.1 mismatch controls (arrowhead, terminal nerve cells; arrow, hypothalamic cells). (H) Knockdown of kal1.1 eliminated the hypothalamic population of cells but did not affect the development of the terminal nerve cells (arrowhead; cf. B). All embryos were 56±1 hpf. Scale bars: 70 µm in A,B,E-H; 100 µm EXPRESSION / LABELING:
|
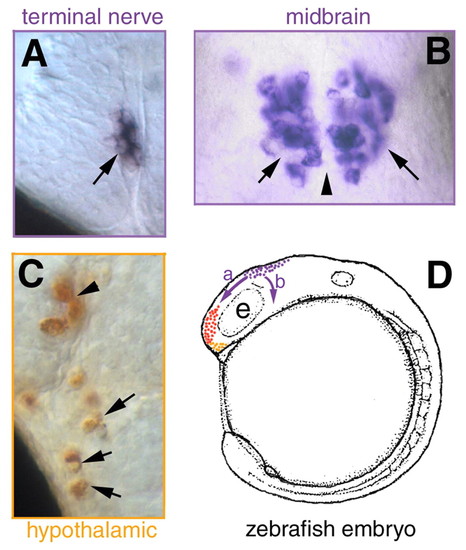
Summary indicating the proposed route of migration for the gnrh3 cells of the terminal nerve and the gnrh2 cells of the midbrain. (A) Terminal nerve gnrh3-expressing cells (arrow) arise from cranial neural crest and migrate rostrally dorsal to the eye (D, purple arrow, a) to join the forming olfactory placode (D, red). (B) Midbrain gnrh2 cells (arrows) lying on either side of the midline (arrowhead) also arise from cranial neural crest and migrate posterior to the developing eye (D, purple arrow, b). (C) Hypothalamic GnRH cells (arrows) arise from the anterior pituitary region [D, orange (see Whitlock et al., 2003 |