- Title
-
hecate, a zebrafish maternal effect gene, affects dorsal organizer induction and intracellular calcium transient frequency
- Authors
- Lyman Gingerich, J., Westfall, T.A., Slusarski, D.C., and Pelegri, F.
- Source
- Full text @ Dev. Biol.
|
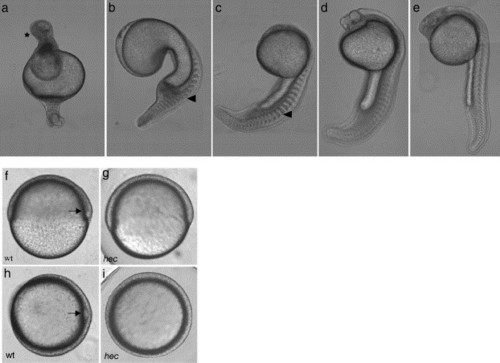
hecate mutant embryos display defects in axis induction at 24 hpf. (a–e) At 24 hpf, the majority of embryos from a given clutch have severe radial ventralization (a) while the remainder exhibit varying degrees of deficiency in dorsoanterior development (b–e). Anterior: top; posterior: bottom; dorsal: right, when identifiable. In panel a, the anterior contains a mass of apparently undifferentiated cells (asterisk). Blocky somites (arrowheads in panels b and c) are characteristic of the absence of a notochord. (f–i) Wild-type (f, h) and hec mutant (g, i) embryos at the shield stage (6 hpf). Wild-type embryos display a characteristic thickening on the dorsal side (arrows in panels f and h) while hec mutant embryos lack this thickening. (f and g: side views; h and i: animal views). |
|
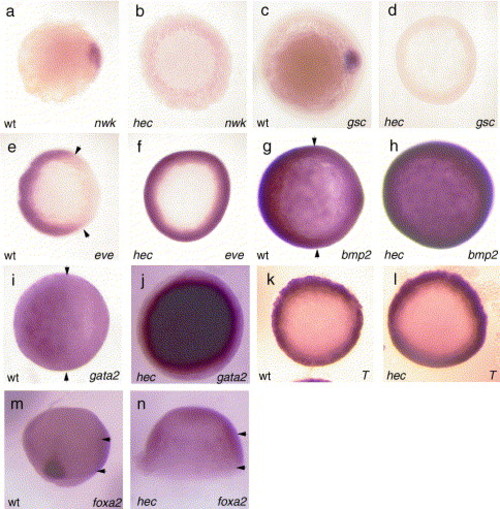
Gene expression analysis of hecate mutant embryos. Whole mount in situ hybridization of embryos shows a reduction in the expression of dorsal genes: nieuwkoid (nwk), at sphere [4 hpf; (a, b)]; goosecoid (gsc), at 50% epiboly [5.3 hpf; (c, d)]; as well as an expansion in the expression of ventral genes: even skipped 1 (eve), at 50% epiboly (e, f); bmp2, at 80% epiboly [7.3 hpf; (g, h)]; gata2, at 80% epiboly (i, j). Expression of the mesendodermal marker gene no tail at 50% epiboly (k, l) and the endodermal marker foxa2 (axial) at 80% epiboly (m, n) show no reduction in germ layer specific staining, although as expected the dorsal domains of expression of these genes are reduced. All panels are animal views with dorsal side to the right (when identifiable), except panels m, which is a dorsal view. EXPRESSION / LABELING:
|
|
β-catenin protein does not localize to the nuclei of hec mutant embryos. Nuclear localization of β-catenin protein was observed in wild-type embryos on the presumptive dorsal side (a, c) but not the presumptive ventral side (b). No nuclear localization was apparent in hec mutant embryos (d–h), β-catenin localization at the membrane can be detected in both wild-type and hec mutant embryos. Animal views of sphere stage embryos (4 hpf). Panels b, c and e–h are higher magnifications of panels a and d, respectively, as indicated by the red boxes in panels a and d. (For interpretation of the references to colour in this figure legend, the reader is referred to the web version of this article.) |

Ca2+ transients occur more frequently in hec mutant embryos than in wild-type embryos. (a–f) Surface plot representations showing the number of Ca2+ transients in individual embryos during the cellular blastoderm stage. Wild-type (a) has less activity when compared to untreated hec embryos (b and e: hec mutant embryos from different females). Sibling embryos from clutches with similar activity to untreated embryo (b) were unilaterally injected with XeC on the left side (c) and L-690,330 on the right side (d). Sibling embryo from a clutch with similar activity to untreated embryo (e) was injected with A-protomer of pertussis toxin on the left side (f). White arrows in panels c, d, and f indicate side of injection and the inset in panel d demonstrates the location of Texas red lineage marker coinjected with the reagent. Embryos were oriented in a lateral view relative to the long axis. The image represents a composite of all the transient activity in a single embryo. The color and peak size represent the total number of Ca2+ transients that occurred in that location in the embryo. The color bar shows the frequency range with low numbers as cooler colors (purple = 0–1) and high numbers as hotter colors (orange–red = 25). Composites in panels a–f were accumulated from 200 data frames, 50 min. (g–h) Graphical output of the number of Ca2+ transients as a function of time (after image analysis was initiated) for wild-type (black) and hec (red) (g). Graphical plot of hec mutant embryo injected with A-protomer of pertussis toxin demonstrating recovery of Ca2+ transients after 45 min (h). Imaging was initiated at the 32- to 128-cell stage (1.75–2.25 hpf = time 0 in plots). (i–k) Surface plot representation showing the number of Ca2+ transients in individual embryos during the cellular blastoderm stage. Wild-type control (i). Wild-type embryo with unilateral injection of tcfBD (j). Wild-type embryo with unilateral injection of β-catenin MO (k). Composites in panels i–k were accumulated from 260 data frames, 65 min. Note that control embryo (i) was imaged for a longer time than the wild-type embryo in panel a; thus, it has more transients in total (and hence the peaks are taller) but a similar frequency of transients. |
|
Decreasing the frequency of Ca2+ transients leads to ectopic dorsal gene expression in hecate mutant embryos. (a–d) Both wild-type and hec mutant embryos show an expansion of cho expression in the margin at 50% epiboly (a and c: DMSO-treated control; b and d: Thapsigargin-treated, animal views). (e–j) Ectopic cho expression in the EVL is not dependent on β-catenin function. Thapsigargin (f, h, j)- and DMSO (e, g, i)-treated wild-type embryos. β-catenin MO effectively suppresses endogenous wild-type cho expression but not the ectopic expression in the EVL in wild-type embryos (g and h). Standard control MO does not affect the level of cho expression (data not shown). Injection of ΔNtcf suppresses both ectopic thapsigargin-induced cho expression and its endogenous expression in the dorsal region (i, j) (animal views, sphere stage, arrows denote expression in EVL). (k–r) Thapsigargin-induced ectopic cho expression occurs in cells of the EVL. Double labeling of cho mRNA using fluorescent situ hybridization (green in panels n and r) and the DNA stain DAPI (pseudocolored red for clarity in panels n and r). Under these labeling conditions, cho expression is observed diffusely in the cytoplasm and in two bright spots likely representing new transcription at the endogenous loci. (k–n) Control (DMSO)-treated embryo (k) and higher magnification views of the endogenous dorsal cho expression domain (red box in panel k). cho is expressed only in the dorsal region, where it is detected in deep cells and a small fraction of EVL cells. Arrows indicate EVL cells, distinguished by their external position and larger, flattened nuclei. Asterisks next to the arrows indicate EVL cells with some detectable expression. (o–r) Thapsigargin-treated embryos show ectopic cho expression in cells of the EVL layer. White arrows and asterisks as in (k–n). Panels are animal views of embryos at 30% epiboly (4.7 hpf). EXPRESSION / LABELING:
|
|
Dorsal gene expression increases in hec mutant embryos upon injection of upstream components of the Wnt/β-catenin pathway. (a–b) Injection of β-catenin mRNA leads to the appearance of dorsal structures in hec mutant embryos (24 hpf; anterior to left). (c–f) The frequency of embryos expressing goosecoid increases after injection with β-catenin RNA (c), dominant negative GSK-3 RNA (XG114) (d), GSK-3 binding protein RNA (e), and zWnt8 + FzA RNAs (f). “Wild-type gsc” refers to the presence of staining in a pattern similar to that seen in similarly staged uninjected wild-type embryos. “Ectopic gsc” refers to the presence of staining in regions in the margin outside the normal wild-type pattern. Presence of staining in a portion of the uninjected hec mutant embryos is due to the differences in expressivity of the phenotype. Injection of β-galactosidase mRNA does not lead to an increase in dorsal gene expression (data not shown). |
Reprinted from Developmental Biology, 286(2), Lyman Gingerich, J., Westfall, T.A., Slusarski, D.C., and Pelegri, F., hecate, a zebrafish maternal effect gene, affects dorsal organizer induction and intracellular calcium transient frequency, 427-439, Copyright (2005) with permission from Elsevier. Full text @ Dev. Biol.


