A progressive fate restriction model for iridophore development from multipotent NCCs.

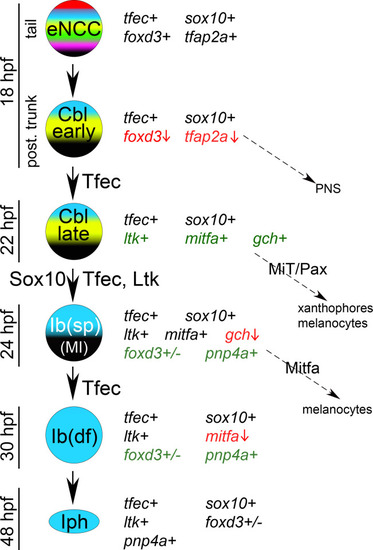
Schematic representation of the previously described model of iridophore generation from the NC, along with the expression characteristics and potential fate choices of individual arising cell types [
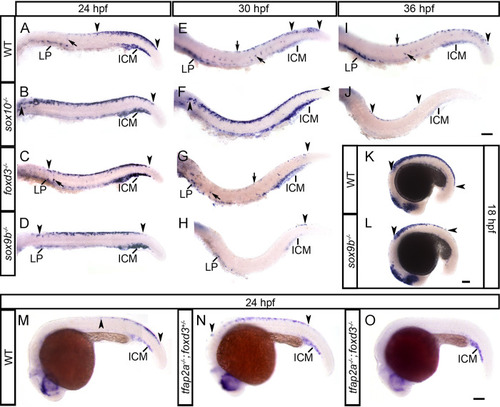
14]. Genes actively expressed in each cell are indicated with a “+” sign. tfec is initially co-expressed with eNCC specification factors, which gradually become downregulated (red font, vertical red arrow), while lineage-specific factors become upregulated (green font). Proteins indicated on the vertical black arrows are considered important for the respective fate specification step. MiT, microphthalmia family transcription factors; PNS, peripheral nervous system.

<italic>tfec</italic> is a marker of differentiated iridophores, but not xanthophores.

(A–D) Chromogenic whole-mount in situ hybridisation reveals tfec expression in iridophores at 3 dpf. Iridophores (asterisks) of the posterior trunk/anterior tail are imaged live with reflected light in lateral (A) and dorsal (B) views. (C,D) Whole-mount in situ hybridisation on the same embryo reveals a pattern of tfec expression matching that of the differentiated iridophores (asterisks). The colour of the asterisks indicates corresponding iridophore patches between A and C, and B and D. Note the absence of expression in the location of the associated melanocytes (residual melanin indicated by arrowheads) (E-G). Expression of tfec (E, in situ hybridisation) and of Pax7 (F, immunofluorescence) in differentiated iridophores and xanthophores, respectively, at 48 hpf; note the absence of co-expression of these markers. A,C,E: lateral views; B,D: dorsal views. Head towards the left. Scale bars: A-D, 50 μm; E-G, 20 μm.

EXPRESSION / LABELING:
Gene:
Antibody:
Fish:
Anatomical Terms:
Stage Range: Long-pec to Protruding-mouth

Loss of <italic>tfec</italic> function eliminates embryonic iridophores.

(A) Schematic showing the distribution of the 8 exons of tfec (orange) in relation to the functional basic helix-loop-helix-leucine zipper domains (green) of the transcription factor. The red arrow indicates the position along both the gene and protein sequences targeted for mutagenesis by the CRISPR/Cas9 system. Included are the targeted WT tfec DNA/amino acid sequence (blue, with PAM underlined), and the sequences of the examined mutant alleles, with the corresponding molecular lesions (dashes for deleted nucleotides, red font for insertions). Imaging live embryos under reflected light reveals a striking lack of iridophores in tfec mutants (D,E) compared to their WT siblings (B,C) along the dorsal (downward arrow), ventral (upward arrow), and yolk sac stripes, as well as overlying the eye (arrowhead). Iridophores are also absent on the dorsal head (C,E, horizontal arrow) and the lateral patches. (F) Quantitation of differentiated iridophores across the dorsal and ventral trunk at 3 dpf confirms a prominent lack of iridophores along the dorsal and ventral stripe of tfec mutants. (G-K) Injection of tfec cDNA can rescue the mutant phenotype. Differentiated iridophores (arrowheads) are abundant on the eye of WT embryos (G), but completely absent from the eye of a tfecvc60 mutant sibling (H) at 4 dpf. Co-injection with Tol2 transposase of a construct where the tfec promoter drives transcription of the tfec cDNA sequence, leads to rescue of iridophores (arrowheads) on the eye (I) and trunk (J) of tfecvc60 mutants. (K) Quantitation of rescue efficiency. Approximately 45% of mutants displayed eye iridophore rescue, 3% showed rescue in the trunk only and 6% showed rescue both in the eyes and trunk (n = 62). By contrast, iridophores were never observed in uninjected tfecvc60 sibling larvae (n = 58). (L) tfec cDNA expressed from the sox10 promoter is capable of rescuing iridophores (arrowheads) in tfecvc60 mutants by 4 dpf. (M) At 3 dpf, numbers of iridophores in the dorsal stripe (DS) of wild-type embryos does not significantly change between uninjected embryos and embryos injected with either of the control constructs (sox10:dsRed, ubi:eGFP; orange “ns”). Embryos injected with sox10:tfec or with ubi:tfec show no significant change in DS iridophore numbers compared to both uninjected, and control injected siblings (sox10:dsRed, ubi:eGFP, respectively; red “ns”). In the ventral stripe (VS), injection of the ubi:tfec construct led to no significant iridophore number alterations, when compared to both control-injected and uninjected siblings (red “ns”). ubi:eGFP-injected controls do not show differences in VS iridophores when compared to uninjected controls (orange “ns”). When injecting sox10:dsRed, a weakly significant increase in VS iridophores is observed (p = 0.04). sox10:tfec injection does not lead to significant changes compared to uninjected controls, but appears to lead to a decrease in numbers when compared to sox10:dsRed (p = 0.002). Dots indicate outliers. sgRNA, small guide RNA; DS, dorsal stripe; VS, ventral stripe; LP, lateral patches; YSS, yolk sac stripe. (B,D, G-J,L): lateral views. (C,E): dorsal views. Head towards the left. Scale bars: 200 μm. (F): spots signify outlier values *, p-value < 10−9 using t-test.

<italic>tfec</italic> can drive ectopic melanogenesis, and functions in the early stages of melanocyte development.

(A,B) tfec cDNA expressed from the ubiquitin promoter induces ectopic melanisation in wild-type embryos by 24 hpf. (C-F) Shown at 72 hpf, tfec expressed from either the ubi or sox10 promoters (E,F) rescues large well-differentiated melanocytes (black arrows) in mitfaw2/w2 embryos, in a manner reminiscent of sox10-driven mitfa (D), as well as apparently smaller, poorly melanised cells (blue arrows) (E,F). (G-I) Pigment cell phenotypes at 30 hpf. Compared to WT siblings (G), tfec mutants (H) have reduced melanisation of the RPE (arrowheads), and reduced melanocytes both along the dorsal trunk (arrows) and on the migratory pathways (asterisks). (I) Quantitation of melanocytes along the dorsal trunk and migratory pathways at 30 hpf reveals a 60% reduction in both regions in tfec mutants with respect to WT siblings. (J-L) Pigment cell phenotypes at 4 dpf. In embryos treated with melanin-concentrating hormone (MCH) to facilitate their quantitation, the number of trunk and tail melanocytes is not significantly altered along the dorsal, ventral or lateral stripes (J,K, red region; quantitated in L), however there is a statistically significant increase in the number of melanocytes located on the dorsal head (J,K, green region; quantitated in L). Scale bars: (A-F), 250 μm; (G,H,J,K), 200 μm. (I,L): spots signify outlier values; *, p-value < 10−9 using t-test.

Specification of melanocytes, iridophores and xanthophores is delayed in <italic>tfec</italic> mutants.

(A-F) pnp4a expression in Ib(sp) requires Tfec. At 24 hpf, the number of dorsally located, and of partially fate restricted, migrating chromatoblasts (arrows) expressing pnp4a is reduced in tfec mutants (A,B). Expression overlying the eye is also affected (A,B, insets). This reduction is still prominent at 30 hpf (C,D), when staining is also visibly affected in the lateral patches. pnp4a expression is undetectable in differentiated iridophore positions (E, asterisks) in tfec mutants at 48 hpf (F). pnp4a+ iridophore lineage cells overlying the RPE are noticeably reduced in tfec mutants compared to WT siblings (A-F, insets). (G-L) Generation of tfec-positive Ib(sp) from late Cbls requires Tfec. At 24 hpf, tfec mutants present with anterior expansion of the tfec+ premigratory NC domain (G,H, arrowheads) and lack of medially migrating, Ib(sp) progenitors (arrows). At 36 hpf, the number of dorsal and migrating tfec+ Ib(df) (arrows), as well as those located in the lateral patches is reduced in mutants, compared to WT or heterozygous siblings (I,J). At 48 hpf, a reduced number of cells (asterisks) express tfec along the dorsal stripe of mutant embryos, compared to WT or heterozygous siblings (K,L). tfec mutant embryos were distinguishable after whole-mount in situ hybridisation by the lack of RPE melanisation (I-L, insets). tfec+ iridophore lineage cells overlying the RPE are noticeably reduced in tfec mutants compared to WT siblings (G-L, insets). (M-R) Mb(sp) generation from the late Cbl is delayed in tfec mutants. At 24 hpf, mitfa marker expression is restricted to an increased number of premigratory Cbls (arrowheads) and is undetectable in migrating Mb(sp) (arrows) in tfec mutants (M,N). At 30 hpf, the numbers and distributions of mitfa-positive late Cbls (arrowheads) are indistinguishable between tfec mutants and WT or heterozygous siblings (O,P), but the delay in Mb(sp) migration (arrows) remains distinguishable towards the tail. tfec mutant embryos lack RPE melanisation (O,P, insets). At 48 hpf, mitfa expression in mature melanocytes (asterisks) is indistinguishable between tfec mutants and WT or heterozygous siblings (Q,R). (S, T) tfec mutants lack ltk expression in premigratory late Cbls (arrowhead), in migrating Ib(sp) (arrow) and in iridoblasts of the eye (insets). (U-X) Xanthoblast (Xbl(sp)) specification from Cbls is delayed, as indicated by examinations of two lineage markers, gch2 (U,V) and aox5 (W,X). At 24 hpf, laterally migrating Xbl(sp) (arrows) are restricted to more anterior regions and precursors located in the head are reduced in tfec mutants (V,X) compared to their WT siblings (U,W). All tfec mutant panels show the tfecba6 allele except (V,X) which show the tfecvc60 allele. LP, lateral patches; m, melanisation. (A-J,M-X): lateral views. (K-L, insets of Q-R): dorsal views. Head towards the left. Scale bars: 100 μm.

Development of skeletal and neural NC derivatives is unaffected in <italic>tfec</italic> mutants.

(A-J) Peripheral nervous system derivatives develop normally in tfec mutants. (A,B) At 4 dpf, the DRG (asterisks) and enteric neurons (arrowheads) number and positioning, as revealed by immunofluorescent detection of Elav1/Hu, is indistinguishable between tfec mutant embryos (B) and WT siblings (A). (C,D) phox2b expression, detected by whole-mount in situ hybridisation, at 72 hpf. The formation and the extent of migration of enteric nervous system progenitors (region between arrowheads) are indistinguishable between tfec mutants and WT siblings. Likewise, expression in the earliest differentiating region of the sympathetic ganglia chain, the superior cervical ganglion (SCG), is unaffected. phox2b expression is also indistinguishable in the hindbrain (white asterisks) and in placode-derived neuronal progenitors in the cranial ganglia associated with the branchial arches (arrows). (E,F) At 48 hpf, sox10 expression analysis showed indistinguishable numbers and distribution of Schwann cells (Sc) occupying the pLLn and spinal nerves. Likewise, oligodendrocyte progenitors throughout the CNS appear normal in their specification, numbers and migration (asterisks). sox10 expression is detectable in iridophore positions (red arrowheads) and in eye iridophores (insets, white arrows), that are strongly affected in homozygous tfec mutants. (G,H) pou3f1 expression analyses at 48 hpf show that glial progenitors on the posterior lateral line nerve (pLLn; area between arrowheads) develop normally in tfec mutants. (I,J) sox10 staining at 30 hpf indicates no observable alterations in the migration of specified neural progenitors through the medial pathway (arrows) in tfec mutants, compared to WT siblings. Likewise, the number and distribution of sox10-positive premigratory NC progenitors (arrowheads) is unaffected. tfec mutants were identified by lack of RPE melanisation (I,J, insets). (K,L) At 30 hpf, dlx2a expression shows that formation of the three streams (s1-s3) of migrating cranial NCCs is unaffected in tfec mutants. Staining is also indistinguishable in the forebrain (f). (M,N) The cranial cartilage at 4 dpf is unaffected in tfec mutants, versus WT siblings, as indicated by Alcian blue staining. Numbered 3–7 are the positions of the branchial arches. (B,H,L,N): tfecvc60 allele, (D,F,J): tfecba6 allele. cb, ceratobranchials; ch, ceratohyal; M, Meckel’s cartilage; nt, neural tube; pq, palatoquadrate. (A-L): lateral views. (M,N): dorsal views. Head towards the left. Scale bars: (A, B, G, H, K-N): 200 μm; (C-F, I, J): 100 μm.

<italic>tfec</italic> is a member of the GRN functioning to specify multipotent NCCs, following their induction.

In sox10, foxd3 and sox9b mutants (B,C,D) at 24 hpf, tfec-positive late Cbls are trapped in the premigratory domain along the trunk, whereas in the WT (A) they are restricted to the dorsal tail (regions between arrowheads). Consistent with failed or delayed development of NC progenitors, migrating (arrow) and LP-located Ib(sp) (A) are reduced (C,D) or completely absent (B). The anterior expansion of the progenitor domain is more pronounced in sox10 mutants (B). Initiation of expression in eNCCs, detected by posterior-most boundary of expression (posterior arrowhead), is normal in sox10 (B) and foxd3 (C) mutants, but is perceptibly delayed in sox9b mutants (D); this effect is also prominent at 18 hpf (L). In 30 hpf WT embryos (E) tfec transcript is detectable in premigratory late Cbls of the posterior tail (region within arrowheads). This domain still shows a dramatic expansion in sox10 mutants (F, arrowheads), while foxd3 (G) and sox9b (H) mutants no longer present with trapped progenitors. Instead, very few tfec+ cells are detectable in the dorsal tail (arrowheads), and there is a prominent reduction in Ib(df) (arrows, lateral patches). (I) In WT embryos at 36 hpf, tfec is still expressed in premigratory Cbls in the posterior-most tail (arrowhead), as well as Ib(df) (arrows). In sox10 mutants (J) trapped premigratory progenitors (region within arrowheads) are reduced, but still visible. tfec expression in the premigratory NC domain (region within arrowheads) is anteriorly shifted in single tfap2a mutants (N), compared to WT siblings (M) at 24 hpf, but completely eliminated in double tfap2a;foxd3 mutants (O). tfec expression is invariably detectable in the intermediate cell mass from 18 hpf to 36 hpf, in WT and mutant embryos (A-O). ICM, intermediate cell mass; LP, lateral patches. Lateral views, head towards the left. Scale bars: 100 μm.

Mitfa represses <italic>tfec</italic> expression in melanoblasts.

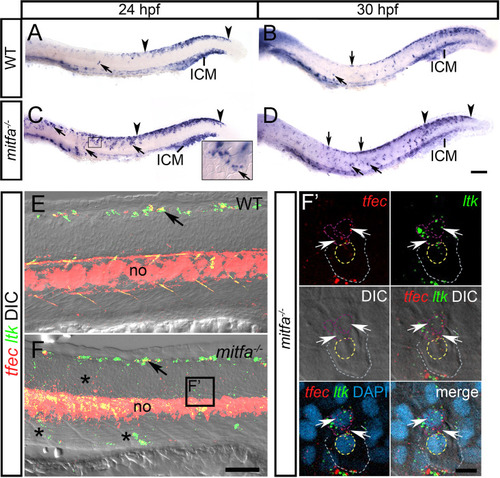
In WT embryos at 24 hpf (A) and at 30 hpf (B), tfec expression is detectable in Ib(sp) and Ib(df) (arrows), respectively, and in the posteriorly regressing early NCC/Cbl domain of the dorsal posterior trunk and tail (region within arrowheads), but expression is undetectable in the lateral migration pathway. At 24 hpf (C) and at 30 hpf (D), mitfa mutants present with an increased number of tfec-positive cells (arrows) along the dorsal trunk, as well as in the medial and lateral (C, inset) migratory pathways. RNAscope (E,F) performed on mitfa mutants at 30 hpf shows an increased number of tfec-positive cells compared to the WT on the migration pathways (F, asterisks). Arrows indicate iridoblast precursors along the dorsal trunk. (F’) RNAscope reveals that in mitfa mutants ectopic tfec-positive cells migrating on the lateral migration pathway (below the epidermis; grey and yellow dashed lines indicate the periphery and nuclear boundary, respectively, of overlying keratinocytes) co-express ltk (arrows; nuclei indicated by purple dashed lines), and thus likely correspond to Ib(sp). ICM, intermediate cell mass; LP, lateral patches; no, notochord. Lateral views, head towards the left. Scale bars: A-D: 100 μm; E,F: 50 μm; F’: 10 μm.

<italic>tfec</italic> is broadly expressed during progressive fate restriction of the iridophore lineage from eNCCs, and is required to specify definitive iridoblast, Ib(df), from the melano-iridoblast, Ib(sp).

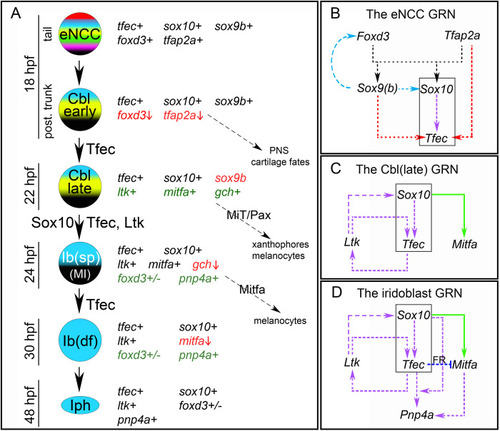
(A) Schematic representation of partially restricted iridophore progenitors during development, along with the expression characteristics and potential fate choices of each ([14], this work). tfec is initially co-expressed with eNCC specification factors, which gradually become downregulated (red font, vertical red arrow), while lineage-specific factors become upregulated (green font). Proteins indicated on the black arrows are considered important for the respective fate restriction step. (B) The position of tfec in the GRN guiding vertebrate NCC induction. Dashed arrows indicate interactions which could be either direct or indirect. In multipotent NCCs, Tfap2a and Foxd3 redundantly activate tfec expression (red arrows; this work), which is later maintained in the iridophore lineage by Sox10 (purple arrow; [14]). This activation occurs independently of previously described co-regulation of zebrafish sox9b and sox10 expression by Tfap2a and Foxd3 (black arrows; [49]), and is unaffected by potentially conserved activation of sox10 and foxd3 by Sox9b (blue arrows, as shown in chick; [50, 51]). (C) Following transition of Cbl early to Cbl late, tfec expression is supported by positive feedback interactions between Sox10, Ltk and Tfec, as described in Petratou et al., 2018 [14]. Sox10 directly activates mitfa expression (solid green arrow; [25]), which during early Cbl specification is co-expressed with tfec [14], inhibiting its expression to bias progenitors towards the melanocyte fate. (D) As the lineage progresses past the Cbl, into the Ib(sp), Ib(df) and mature iridophore stages, factor R (FR) mediates Tfec-dependent downregulation of Mitfa (dark blue edge), and expression of the marker pnp4a becomes prominent [14]. In (B-D) the black box outlines the core connecting the three networks. MiT, microphthalmia family transcription factors; PNS, peripheral nervous system.

Acknowledgments
This image is the copyrighted work of the attributed author or publisher, and ZFIN has permission only to display this image to its users. Additional permissions should be obtained from the applicable author or publisher of the image. Full text @ PLoS One