- Title
-
Olfactory sensory system develops from coordinated movements within the neural plate
- Authors
- Torres-Paz, J., Whitlock, K.E.
- Source
- Full text @ Dev. Dyn.
|
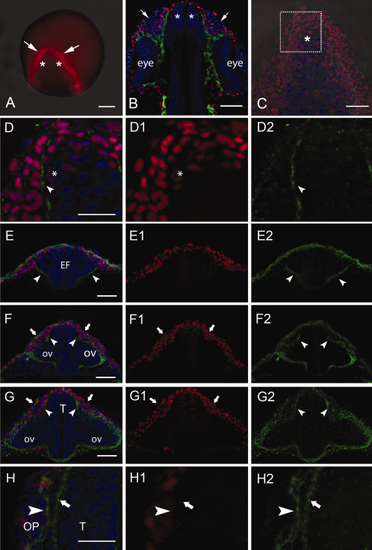
The Dlx3b protein is expressed in the developing olfactory sensory system. A: The Dlx3b protein (red) is highly expressed in the anterior border of the neural plate at 2 somite stage (ss) in the region giving rise to the olfactory placode (OP) (arrows) and adjacent medial cells (asterisks) will contribute to the telencephalon. B: At 24 hours postfertilization (hpf), the OPs are evident (arrows) adjacent to the telencephalon (asterisks). Cells in green are Sox10:GFP positive neural crest cells separating the OPs from the telencephalon. C,D: Whole-mount embryos, dorsal view, anterior toward top of page. Dlx3b protein 2 ss in the anterior neural plate where region of interest (C, boxed area) shows Dlx3b positive nuclei in the border of the neural plate (D, D1, red) with the initiation of laminin immunoreactivity (D, D2, green, arrow). E: At 2 ss, laminin signal is observed in the ventral border of the eye field (E, E2, green, arrowheads). The dorsal olfactory field (E, E1, red) is not divided by laminin expression at this stage. F: At 8 ss, the laminin signal extends dorsally (F, F2, arrowheads) reaching the telencephalic and OP fields (F, F1, red, arrows). G: At 14 ss, laminin immunoreactivity (G, G2, arrowheads) separates telencephalic and OP fields (G, G1, arrows). H: At 20 ss, laminin immunoreactivity is much stronger (H, H2) and is localized to the region of the basal lamina of the OP (H, H2, arrowhead) and telencephalon (H, H2, arrows). All images are whole-mount embryos. A–D, H are dorsal views; E–G, are frontal views. EF, eye field; GFP, green fluorescent protein; ov, optic vesicle, T, telencephalon. Scale bars = 100 μm in A; 50 μm in B,C; 25 μm in D; 50 µm in E–G; 25 μm in H. |
|
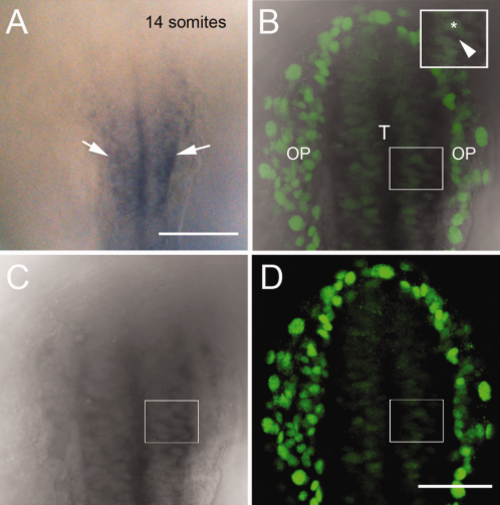
Expression of emx1 colocalizes with Dlx3b in the developing telencephalon. A: Transmitted light image of whole-mount embryo processed for emx1 expression marking the telencephalon (arrowheads). B–D: Different preparation of 14 ss whole-mount embryo with Dlx3b immunodetection (B, D green) after in situ hybridization for emx1 (B,C, dark gray). Merged image of 3 µm focal plane (B) colocalizes Dlx3b signal (green) with transmitted light image of emx1 in situ (gray). Inset box in B shows higher magification of cells expressing Dlx3b (asterisk) and emx1 (arrowhead). All embryos are dorsal views with anterior toward top of page. OP, olfactory placodes; T, telencephalon. Scale bars = 100 μm in A; 50 μm in B–D. |
|
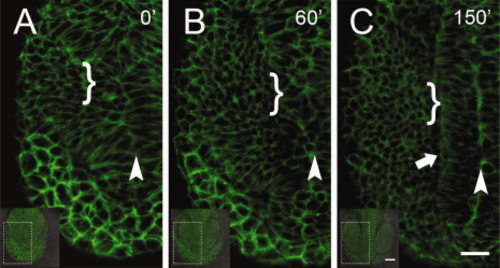
Analysis of early cell movements reveals a continuous field of B-actin:Gap43-GFP expressing cells. A–C: Initially, at 4 somite stage (ss), it is possible to identify the region of the forming neural tube lumen (A, arrowhead) but not the lateral neural tube which becomes well defined by 6–7 ss (C, arrowhead). The region of the pollster (anterior prechordal plate) initially (A,B) showed the most intense Bactin:GFP expression. The OP precursors lie very dorsal, and by 9–10 ss (C) become very round in shape (brackets). Dorsal view, anterior toward bottom of page. GFP, green fluorescent protein. Scale bars = 50 µm in insets; 25 µm in A–C (see Supp. Movie S1). |
|
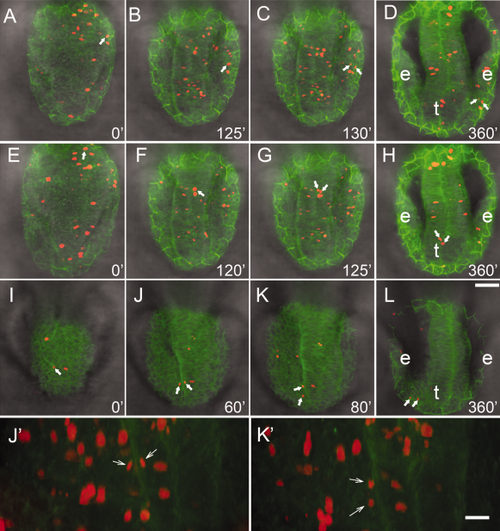
Lineage analysis of cell movements of H2B:RFP positive clones in the β-actin:GAP43-GFP line. All in vivo tracking was initiated at 4 ss. A–L: Image of 6-µm slices taken from total z-stacks ranging from 50–75 µm, dorsal view. J′,K′: Projections of three-dimensional reconstructions from 50 µm z-stacks, from preparations J and K, ventral view. A–D: Cells (red, arrows) contributing to the OP were tracked over the course of the movie (see Supp. Movie S2). E–H: Cells (red, arrows) contributing to the telencephalon (t) were tracked over the course of the movie (see Supp. Movie S3). I–L: Cells (red, arrows) originating medially but contributing to the OP are tracked over the course of the movie (see Supp. Movie S4). Cells divide (J,J′, arrows) and both cells cross into the PNS (K,K′, arrows). Scale bars = 50 µm in A–L; 20 µm in J′,K′. |
|
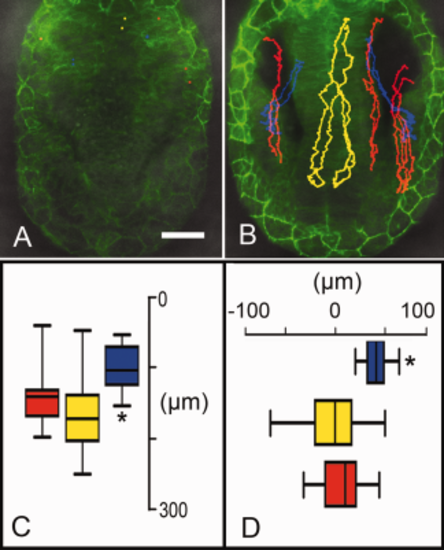
Cell migration of different H2B:RFP positive cells within one β-actin:GAP43-GFP embryo. A,B: Cells tracked in red become OP cells, yellow telencephalic cells (see Supp. Movie S5). Cells shown tracked in blue contribute to visual system eyes (see Supp. Movie S6). Anterior is toward bottom of page, dorsal views. C: Plot of anterior posterior movements (in µms) of cells tracked in A and B. D: Plot of lateral movements (in µms) of cells tracked in A and B. Scale bar = 50 µm in C,D: P ≥ 0.005 for all values. GFP, green fluorescent protein; RFP, red fluorescent protein. |
|
The anterior migration of cranial neural crest initiates the morphological division of peripheral and central olfactory system. Stills from movie using sox10:RFP;Bactin:Gap43-GFP embryos. A,B: Starting at 14 somite stage (ss), cells that will form olfactory placode (OP) (green, arrowheads) lose their rounded appearance. CNC cells (red) advance anteriorly moving between the compacting OP and the neural tube. C,D: As the CNC cells move anteriorly the cells change shape (red, asterisk) appearing to squeeze between the forming the neural tube and OP. Movies were initiated at 14 ss and ended 3 hr later at 19–20 ss (n = 6). Dorsal view; anterior toward bottom of page. GFP, green fluorescent protein; RFP, red fluorescent protein. Scale bar = 25 µm (see Supp. Movie S7). |
|
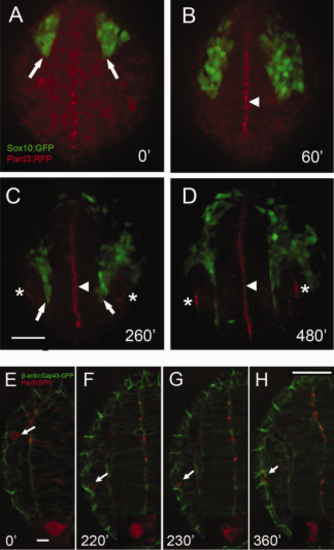
Cell polarization in the olfactory field occurs as cranial neural crest (CNC) cells migrate anteriorly. A–D: Still images from movies of Pard3:RFP (red) injected into Sox10:GFP embryo; images are a projection of a 30 µm z-stack. E–H: Pard3:RFP (red) injected into β-actin:Gap43-GFP embryo; images are a projection of a 6-µm z-stack. At 10 ss, before the anterior migration of the CNC (arrows, A) Pard3-RFP signal is homogeneously distributed in the forming neural tube. B: As CNC cells migrate Pard3:RFP (red) signal becomes localized in the lumen of the neural tube (arrowhead, B–D). C: As CNC cells separate olfactory placodes (OPs) and neural tube (arrows) apical accumulation of the Pard3-RFP protein is observed OP where the nares will form (asterisks, C,D). E–H: Tracking of single Pard3:RFP cell (E–H, red, arrow), where initially Pard3-RFP is evenly distributed in the cell cytoplasm (inset E–F) before placode formation. At 16–17 ss (F, inset) the cell will initiate mitosis and has divided 20′ later (G, inset). Two hours later cells are polarized with Pard3:RFP signal at the apical side of the cells (H, inset). All images are dorsal views, anterior toward bottom of page. Time is indicated in minutes after the beginning of the movies at 10 ss (0′). Images are maximum intensity projection of 30 µm (A–D) and 6 µm (E–H). GFP, green fluorescent protein; RFP, red fluorescent protein. Scale bar = 50 µm in C,H 10 µm in inset in E. |
|
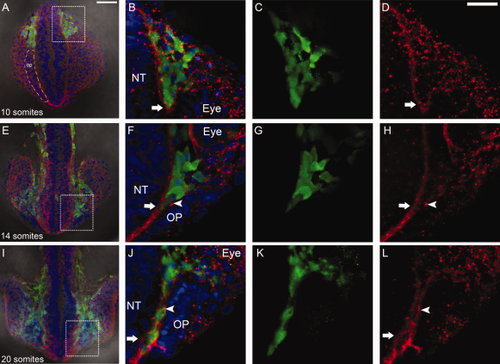
Anterior migration of neural crest is accompanied by changes in the basal lamina. A,E,I: Whole-mount heads in dorsal view at 10 somite stage (ss) (A), 14 ss (E), and 20 ss (I). Boxed area show region of interest shown at higher magnification. A: Region of cells that will give rise to olfactory placode (OP) indicated by dashed outline (op). B–D: The leading edge of Sox10:GFP positive CNC (green) moves as a group surrounded by laminin (red, arrow). F–H: The cranial neural crest (CNC) (green) passes anterior separating the lamina of the neural tube (NT, red, arrow) and OP (red, arrowhead). J-L: CNC (green) is now flanked by laminin on both the side of the NT (red, arrow) and OP (red, arrowhead). Scale bars = 50 µm in A,E,I; 25 µm in B–D,F–H,J–L. |
|
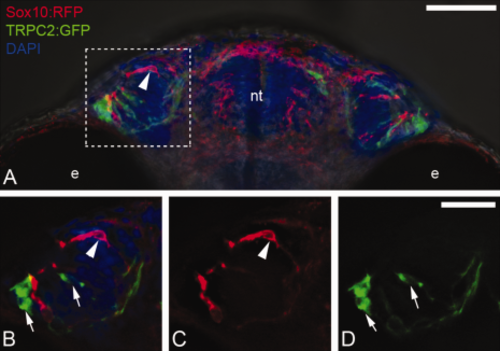
Sox10:RFP positive neural crest does not contribute to TRPC2:GFP positive microvillar neuronal populations within the olfactory sensory epithelium. A: Whole-mount head at 55 hours postfertilization viewed from ventral. Boxed area indicates region of interest shown in B–D. B: Expression of Sox10:RFP (red, arrowhead) and TRPC2:GFP (green, arrows) in the OP. B: TRPC2:GFP (arrows) in the olfactory organ. C: Expression of Sox10:RFP (arrowhead) in the olfactory organ. B–D: Images are 3 µm optical sections. GFP, green fluorescent protein; RFP, red fluorescent protein. Scale bars = 50 µm in A; 25 µm in B–D. |
|
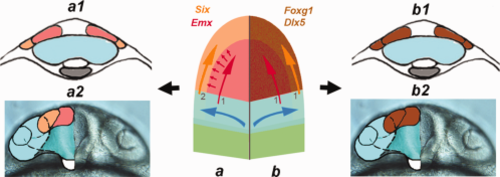
The olfactory sensory system develops as an integrated unit. Center: Schematic of anterior neural plate during early somitogenesis with left side (a) representing the current model with the central olfactory field (1) (telencephalon, red, red arrow) inducing (small red arrows) the peripheral olfactory field (OP, orange, orange arrow) secondarily (2) from ectoderm. Cross-section of forming neural tube at 2 ss (a1) and 20 ss (a2) showing visual field cells (blue) and telencephalic field (red) and the OP (orange). On right (b) the central olfactory field + peripheral olfactory fields (brown) are induced together (1,1) as a common field with shared morphogenetic movements. Cross-section of forming neural tube at 2 ss (b1) and 20 ss (b2) with visual field cells (blue) and a shared central olfactory field + peripheral olfactory fields (brown). Blue shape and arrows represent movements of optic vesicle field during morphogenesis. a2, b2) frontal view of head corresponding to 20 ss. a1, a2, b1, b2 modified from (Whitlock, 2008). |

