
IMAGE
Fig. 5
- ID
- ZDB-IMAGE-170413-38
- Publication
- Torres-Paz et al., 2014 - Olfactory sensory system develops from coordinated movements within the neural plate
- All Figures
- Figures for Torres-Paz et al., 2014
Image
|
Figure Caption
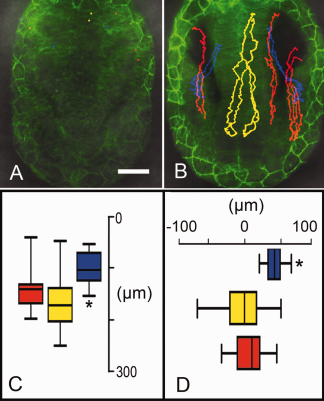
Fig. 5
Cell migration of different H2B:RFP positive cells within one β-actin:GAP43-GFP embryo. A,B: Cells tracked in red become OP cells, yellow telencephalic cells (see Supp. Movie S5). Cells shown tracked in blue contribute to visual system eyes (see Supp. Movie S6). Anterior is toward bottom of page, dorsal views. C: Plot of anterior posterior movements (in µms) of cells tracked in A and B. D: Plot of lateral movements (in µms) of cells tracked in A and B. Scale bar = 50 µm in C,D: P ≥ 0.005 for all values. GFP, green fluorescent protein; RFP, red fluorescent protein.
Acknowledgments
This image is the copyrighted work of the attributed author or publisher, and
ZFIN has permission only to display this image to its users.
Additional permissions should be obtained from the applicable author or publisher of the image.
Full text @ Dev. Dyn.