
Fig. 4
- ID
- ZDB-IMAGE-170413-37
- Publication
- Torres-Paz et al., 2014 - Olfactory sensory system develops from coordinated movements within the neural plate
- All Figures
- Figures for Torres-Paz et al., 2014
|
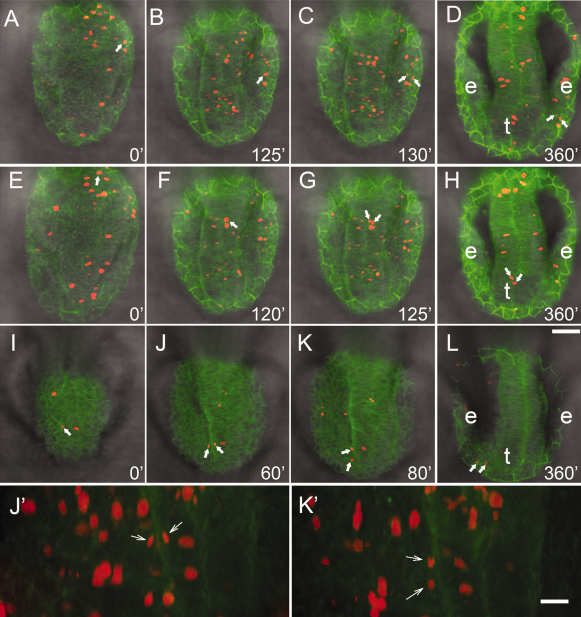
Fig. 4
Lineage analysis of cell movements of H2B:RFP positive clones in the β-actin:GAP43-GFP line. All in vivo tracking was initiated at 4 ss. A–L: Image of 6-µm slices taken from total z-stacks ranging from 50–75 µm, dorsal view. J′,K′: Projections of three-dimensional reconstructions from 50 µm z-stacks, from preparations J and K, ventral view. A–D: Cells (red, arrows) contributing to the OP were tracked over the course of the movie (see Supp. Movie S2). E–H: Cells (red, arrows) contributing to the telencephalon (t) were tracked over the course of the movie (see Supp. Movie S3). I–L: Cells (red, arrows) originating medially but contributing to the OP are tracked over the course of the movie (see Supp. Movie S4). Cells divide (J,J′, arrows) and both cells cross into the PNS (K,K′, arrows). Scale bars = 50 µm in A–L; 20 µm in J′,K′.