
Fig. 7
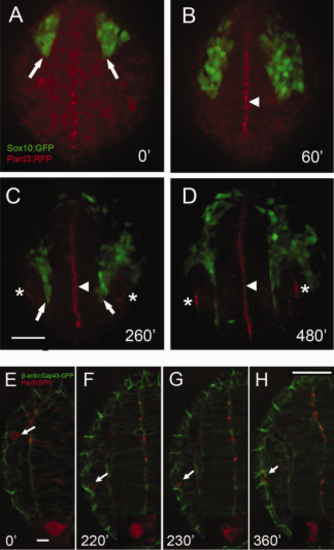
Cell polarization in the olfactory field occurs as cranial neural crest (CNC) cells migrate anteriorly. A–D: Still images from movies of Pard3:RFP (red) injected into Sox10:GFP embryo; images are a projection of a 30 µm z-stack. E–H: Pard3:RFP (red) injected into β-actin:Gap43-GFP embryo; images are a projection of a 6-µm z-stack. At 10 ss, before the anterior migration of the CNC (arrows, A) Pard3-RFP signal is homogeneously distributed in the forming neural tube. B: As CNC cells migrate Pard3:RFP (red) signal becomes localized in the lumen of the neural tube (arrowhead, B–D). C: As CNC cells separate olfactory placodes (OPs) and neural tube (arrows) apical accumulation of the Pard3-RFP protein is observed OP where the nares will form (asterisks, C,D). E–H: Tracking of single Pard3:RFP cell (E–H, red, arrow), where initially Pard3-RFP is evenly distributed in the cell cytoplasm (inset E–F) before placode formation. At 16–17 ss (F, inset) the cell will initiate mitosis and has divided 20′ later (G, inset). Two hours later cells are polarized with Pard3:RFP signal at the apical side of the cells (H, inset). All images are dorsal views, anterior toward bottom of page. Time is indicated in minutes after the beginning of the movies at 10 ss (0′). Images are maximum intensity projection of 30 µm (A–D) and 6 µm (E–H). GFP, green fluorescent protein; RFP, red fluorescent protein. Scale bar = 50 µm in C,H 10 µm in inset in E. |