
- Title
-
Forward Genetic Screens in Zebrafish Identify Pre-mRNA-Processing Pathways Regulating Early T Cell Development
- Authors
- Iwanami, N., Sikora, K., Richter, A.S., M�nnich, M., Guerri, L., Soza-Ried, C., Lawir, D.F., Mateos, F., Hess, I., O'Meara, C.P., Schorpp, M., Boehm, T.
- Source
- Full text @ Cell Rep.
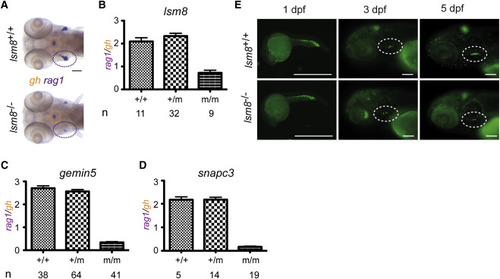
Impaired Early T Cell Development in Zebrafish Mutant for Genes Encoding Components of snRNPs, Related to Figures S1?S3 (A) Diagnostic whole-mount RNA in situ hybridization pattern in lsm8 mutants using rag1 (thymus encircled in purple), and gh (hypophysis encircled in orange) at 5 dpf. Scale bar, 10 ?m. (B?D) Quantification of the rag1/gh ratios as a measure of thymopoietic activity at 5 dpf. The number (n) of individual fish per genotype is indicated; mean � SEM. (E) In homozygous lsm8 mutants (additionally transgenic for an ikaros:eGFP reporter), the number of ikaros-expressing cells in the thymus (encircled with dotted lines in middle and right panels) is drastically reduced at 5 dpf. Note the normal numbers of ikaros-positive cells in general hematopoietic tissues at 1 dpf. Scale bars, 100 ?m. |
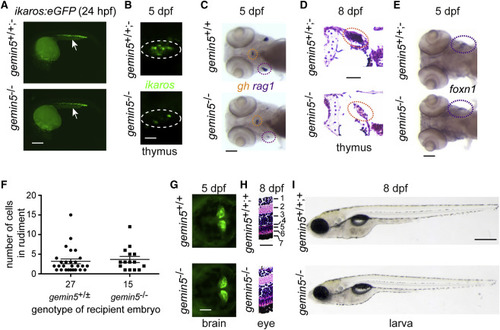
Tissue-Restricted Abnormalities in gemin5 Mutants, Related to Figure S5 (A) Normal numbers and distribution of fluorescent lymphoid progenitor cells visualized in an ikaros:eGFP transgenic background (arrows). Scale bar, 10 ?m. (B) Reduced numbers of ikaros-expressing lymphocyte progenitors in the mutant thymus. Scale bar, 25 ?m. (C) Diagnostic whole-mount RNA in situ hybridization pattern in gemin5 mutants using rag1 (thymus encircled in purple), and gh (hypophysis encircled in orange) at 5 dpf. Scale bar, 100 ?m. (D) Lack of thymocytes in the thymus (red circle) at 8 dpf (H&E staining). Scale bar, 25 ?m. (E) Expression of the thymic epithelial marker foxn1 (thymus encircled in purple) at 5 dpf. Scale bar, 100 ?m. (F) Normal receptive capacity of mutant thymic epithelium for whole kidney marrow hematopoietic cells isolated from adult wild-type ikaros:eGFP transgenic fish. At 5 dpf, the number of transplanted cells per embryo was determined. The overall success rate of the transplantation procedure is identical between the genotypes. (G) Distribution of ikaros-expressing neurons in the mutant hindbrain. Scale bar, 100 ?m. (H) Retinal cell layers (1, ganglion cell layer; 2, inner plexiform layer; 3, inner nuclear layer; 4, outer plexiform layer; 5, outer nuclear layer; 6, photoreceptor cell layer; 7, retinal pigment epithelium) (right panel); H&E staining. Scale bar, 25 ?m. (I) Body size at 8 dpf. Scale bar, 500 ?m. No differences were observed for gemin5+/+ and gemin5+/? fish for any of the analyzed parameters. |

ZFIN is incorporating published figure images and captions as part of an ongoing project. Figures from some publications have not yet been curated, or are not available for display because of copyright restrictions. PHENOTYPE:
|
|
ZFIN is incorporating published figure images and captions as part of an ongoing project. Figures from some publications have not yet been curated, or are not available for display because of copyright restrictions. |

Characterization of tnpo3 Mutants, Related to Figure S5 (A) Reduction of ikaros-expressing cells in the thymus (encircled with dotted lines in middle and right panels) of homozygous tnpo3 mutants (additionally transgenic for an ikaros:eGFP reporter). Note the normal numbers of ikaros-positive cells in general hematopoietic tissues at 1 dpf. Scale bars, 100 ?m. (B) Maturation block of thymocytes. Few ccr9b-positive thymocytes (insets in 4 dpf panels) in tnpo3 mutants express rag1. Scale bars, 100 ?m. (C) Thymopoietic indices at 5 dpf. Each symbol represents one animal. The mean � SEM is indicated. Scale bar, 100 ?m. (D) Analysis of ptprc isoforms by RT-PCR; size markers are indicated. (E) Masking genetic interaction between gemin5 and tnpo3 mutations in zebrafish. The thymopoietic indices (rag1/gh ratio; mean values � SD) at 5 dpf are given for fish (genotypes denoted in bars) resulting from crosses of parents heterozygous for both gemin5 and tnpo3; the observed thymopoietic index for gemin5?/?;tnpo3?/? double mutants is significantly higher than that expected from the indices of single mutants under the multiplicative model of genetic interaction. The numbers of fish in each group is indicated. (F) Alternative splicing events in tnpo3 mutants at 4 dpf. Bar chart shows the number of significant AS events per condition at a false discovery rate (FDR) of 1% for five different AS event types. The total numbers of tested AS events are indicated on the right. (G) Genes affected by exon-skipping events. (H) Genes exhibiting transcriptional upregulation. (I) Genes exhibiting transcriptional downregulation. (J) Summary of the network structure involving snapc3, lsm8, gemin5, and tnpo3 genes. +, alleviating genetic interaction; ?, synthetic interaction; ?, unclear. PHENOTYPE:
|
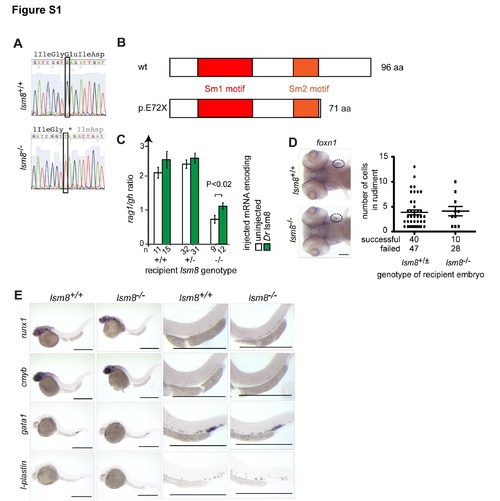
Characterization of lsm8 mutants. Related to Figure 1 (A) Representative sequence traces indicating the G>T transition at nucleotide position 8611002 (Zv9) on chromosome 4; conceptual translation of the nucleotide sequence is indicated in three-letter code (stop codon is marked by *). (B) Deduced protein structure of wild-type and predicted mutant (E72X) proteins. (C) Phenotypic rescue of lsm8 mutation by injection of wild-type zebrafish (Dr) lsm8 mRNA as determined by the extent of thymopoietic activity (as measured by the ratio of hybridization signals obtained for rag1 and growth hormone [gh]); error bars represent S.E.M.; the significance level of the difference is indicated (t-test; two-tailed). The number (n) of embryos analyzed is indicated. (D) Functionally competent thymic rudiment in lsm8 mutants. At 5 dpf, expression of the thymopoietic marker foxn1 in mutant embryos is indistinguishable from that in wild-type embryos (circles; left panels). To examine the receptive capacity of thymic rudiments, purified ikaros-positive hematopoietic kidney marrow cells from adult wild-type ikaros:eGFP transgenic fish were injected into the sinus venosus of wild-type and heterozygous embryos (collectively designated as +/� genotypes) and lsm8 mutant embryos at 2 dpf. 72 hours later, the numbers of green cells in the rudiment were counted; a total of 40 lsm8+/� and 10 lsm8-/- embryos were successfully injected; transplantation failed in 47 (54%) and 28 (74%) embryos, respectively. Scale bar, 10 ?m. (E) Characterization of early hematopoiesis. Whole mount RNA in situ hybridization was carried out with the indicated probes at various time points. runx1, 36 hpf. cmyb, 36 hpf; gata1, 24 hpf; l-plastin, 24 hpf. Shown are overviews (left panels) and magnifications (right panels). Scale bars, 50 ?m. |

Characterization of snapc3 mutants. Related to Figure 1 (A) Representative sequence traces indicating the G>T transition at nucleotide position 8611002 (Zv9) on chromosome 1; conceptual translation in three-letter code (stop codon is marked by *). (B) Deduced protein structure of wild-type and predicted mutant (C297X) proteins. (C) Diagnostic whole-mount RNA in situ hybridization pattern in snapc3 mutants using rag1 and gh at 5 days post fertilization (dpf). Scale bars, 10 ?m. (D) Quantification of thymopoietic activity in snapc3 mutants expressed as a ratio of rag1 to gh signals derived from analyses illustrated in (C). (E) Phenocopy of the snapc3 mutation by antisense morpholino oligonucleotides; splice acceptor (SA) morpholino, transcriptional start site (ATG) morpholino. Scale bars, 10 ?m. (F) The rag1/gh ratios as a measure of thymopoietic activity exemplified in (E) are quantified at 4 dpf (right panel); **, P<0.01; ***, <0.001 (t-test; two-tailed). (G) In contrast to similar numbers of ikaros-expressing neurons in the hindbrain, the number of ikarosexpressing thymocytes is greatly reduced in snapc3 mutants at 5 dpf. Scale bars, 10 ?m. (H) Characterization of early hematopoiesis. Whole mount RNA in situ hybridization was carried out with the indicated probes at various time points. runx1, 36 hpf. cmyb, 36 hpf; gata1, 24 hpf; l-plastin, 24 hpf. Shown are overviews (left panels) and magnifications (right panels). Scale bars, 50 ?m. |
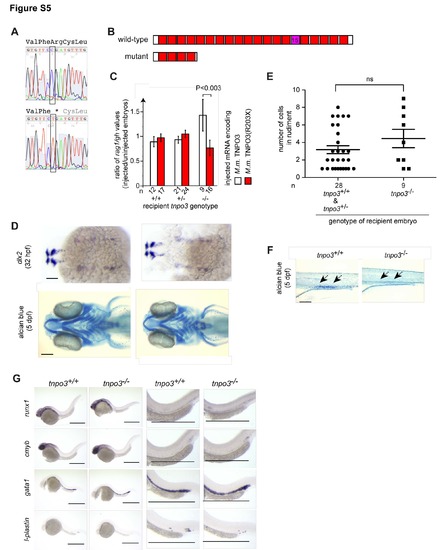
Characterization of tnpo3 zebrafish mutants. Related to Figure 5. (A) Representative sequence traces indicating the C>T transversion at nucleotide position 12,656,091 (Zv9); conceptual translation of the nucleotide sequence is indicated in three-letter code (stop codon is marked by *). (B) Schematic of the deduced wild-type and mutant TNPO3 protein structures. The 15th HEAT repeat that interacts with RS domains is indicated. (C) Rescue of tnpo3 mutation by injection of wild-type mouse Tnpo3 mRNA (encoding protein ENSMUSP00000012679), but not mutant (R203X) mouse mRNA. The ratio of thymopoietic activity (as measured by the ratio of hybridization signals obtained for rag1 and growth hormone [gh]) for injected relative to uninjected embryos of the indicated genotypes is shown; error bars represent S.E. M.; the significance level of difference is indicated (t-test, two-tailed). The number (n) of embryos analysed is indicated. (D) Absence of eye and craniofacial abnormalities in tnpo3 mutant embryos, as determined by RNA in situ hybridization to dlx2 and staining of cartilage with alcian blue. Panels are representative of at least 3 animals. Scale bars, 100 ?m. (E) Functionally competent thymic rudiment in tnpo3 mutants. To examine the receptive capacity of thymic rudiments, purified whole kidney marrow cells from adult wild-type ikaros:eGFP transgenic fish were injected into the sinus venosus of tnpo3 wild-type (+/+) and heterozygous (+/-) embryos and mutant (-/-) embryos at 2 dpf. After an additional 72 hours, the numbers of green cells in the rudiment were counted (mean�S.E.M.). A total of 80 tnpo3+/� and 27 tnpo3-/- embryos were injected; transplantation failed in 52 (65%) and 18 (67%) of these embryos, respectively; the difference between the groups is not significant (t-test; two-tailed). (F) Reduced numbers of alcian blue-positive goblet cells in the intestine (arrows) of tnpo3 mutants. Panels are representative of at least 3 animals. Scale bar, 100 ?m. (G) Characterization of early hematopoiesis. Whole mount RNA in situ hybridization was carried out with the indicated probes at various time points. runx1, 36 hpf. cmyb, 36 hpf; gata1, 24 hpf; l-plastin, 24 hpf. Shown are overviews (left panels) and magnifications (right panels). Scale bars, 50 ?m. |