
Fig. S5
- ID
- ZDB-IMAGE-161220-7
- Publication
- Iwanami et al., 2016 - Forward Genetic Screens in Zebrafish Identify Pre-mRNA-Processing Pathways Regulating Early T Cell Development
- All Figures
- Figures for Iwanami et al., 2016
|
Fig. S5
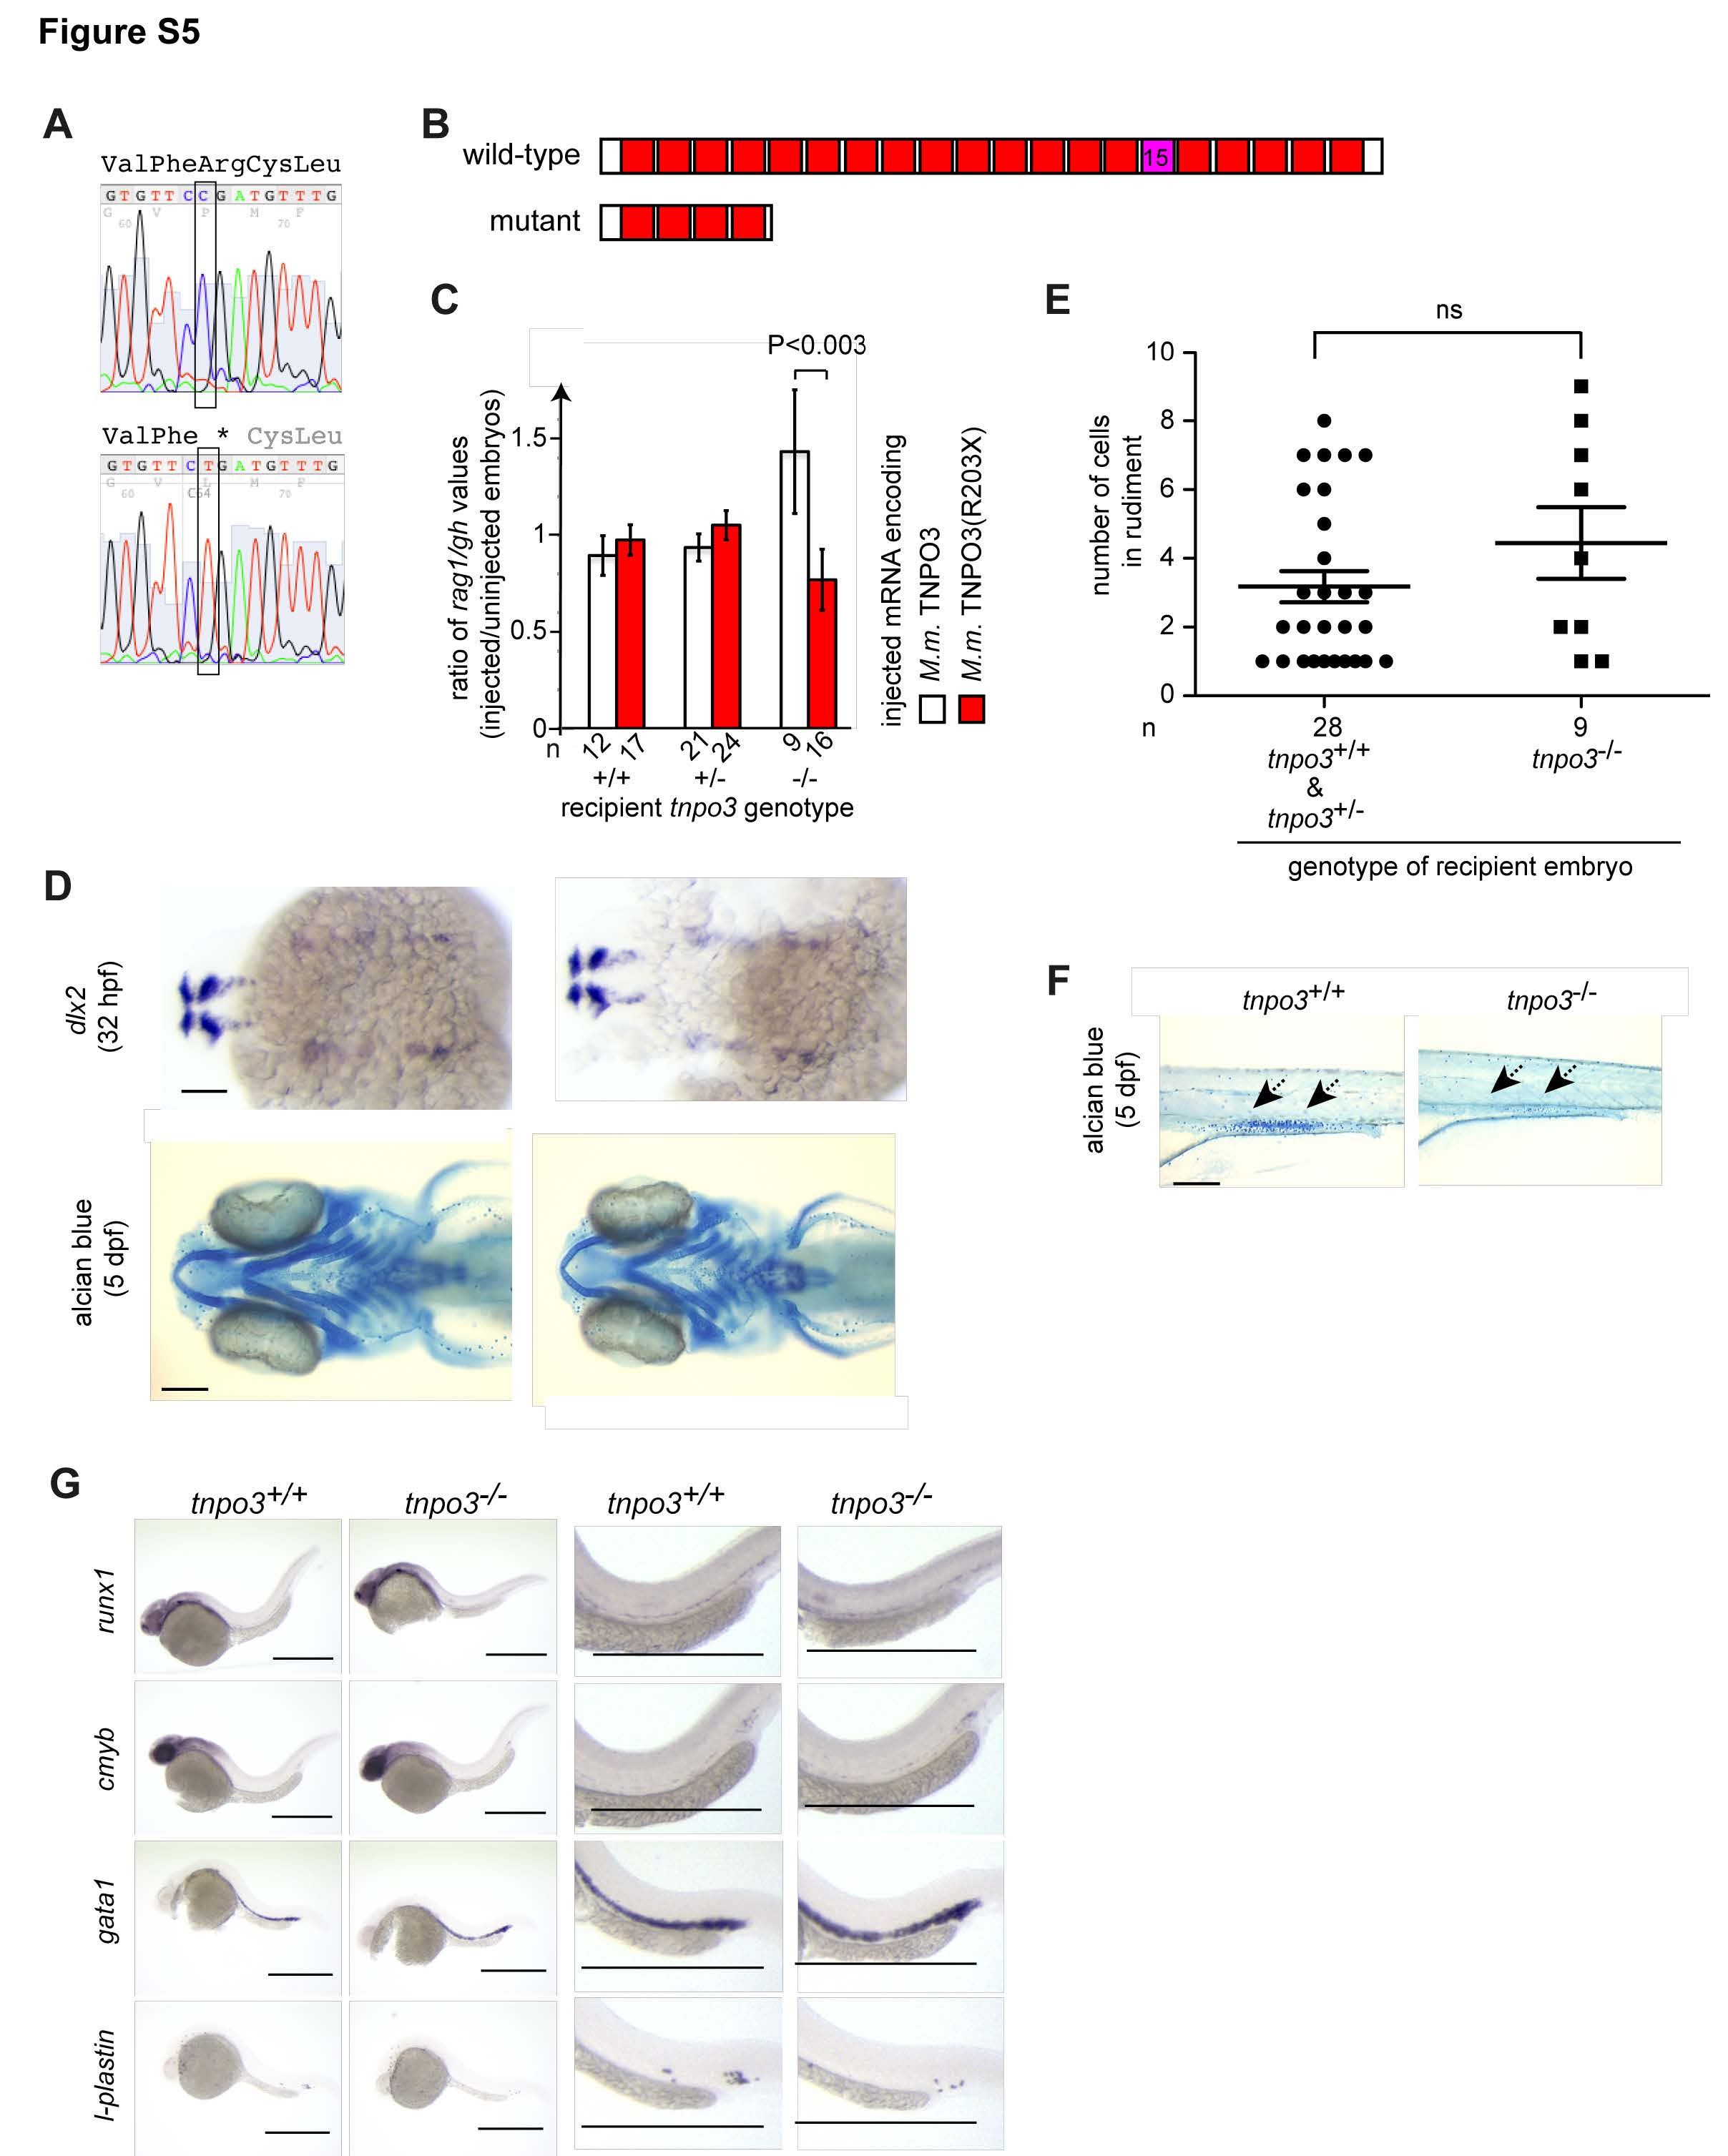
Characterization of tnpo3 zebrafish mutants. Related to Figure 5.
(A) Representative sequence traces indicating the C>T transversion at nucleotide position 12,656,091 (Zv9); conceptual translation of the nucleotide sequence is indicated in three-letter code (stop codon is marked by *).
(B) Schematic of the deduced wild-type and mutant TNPO3 protein structures. The 15th HEAT repeat that interacts with RS domains is indicated.
(C) Rescue of tnpo3 mutation by injection of wild-type mouse Tnpo3 mRNA (encoding protein ENSMUSP00000012679), but not mutant (R203X) mouse mRNA. The ratio of thymopoietic activity (as measured by the ratio of hybridization signals obtained for rag1 and growth hormone [gh]) for injected relative to uninjected embryos of the indicated genotypes is shown; error bars represent S.E. M.; the significance level of difference is indicated (t-test, two-tailed). The number (n) of embryos analysed is indicated.
(D) Absence of eye and craniofacial abnormalities in tnpo3 mutant embryos, as determined by RNA in situ hybridization to dlx2 and staining of cartilage with alcian blue. Panels are representative of at least 3 animals. Scale bars, 100 μm.
(E) Functionally competent thymic rudiment in tnpo3 mutants. To examine the receptive capacity of thymic rudiments, purified whole kidney marrow cells from adult wild-type ikaros:eGFP transgenic fish were injected into the sinus venosus of tnpo3 wild-type (+/+) and heterozygous (+/-) embryos and mutant (-/-) embryos at 2 dpf. After an additional 72 hours, the numbers of green cells in the rudiment were counted (mean±S.E.M.). A total of 80 tnpo3+/± and 27 tnpo3-/- embryos were injected; transplantation failed in 52 (65%) and 18 (67%) of these embryos, respectively; the difference between the groups is not significant (t-test; two-tailed).
(F) Reduced numbers of alcian blue-positive goblet cells in the intestine (arrows) of tnpo3 mutants. Panels are representative of at least 3 animals. Scale bar, 100 μm.
(G) Characterization of early hematopoiesis. Whole mount RNA in situ hybridization was carried out with the indicated probes at various time points. runx1, 36 hpf. cmyb, 36 hpf; gata1, 24 hpf; l-plastin, 24 hpf. Shown are overviews (left panels) and magnifications (right panels). Scale bars, 50 μm.