
- Title
-
Establishment of Gal4 transgenic zebrafish lines for analysis of development of cerebellar neural circuitry
- Authors
- Takeuchi, M., Matsuda, K., Yamaguchi, S., Asakawa, K., Miyasaka, N., Lal, P., Yoshihara, Y., Koga, A., Kawakami, K., Shimizu, T., Hibi, M.
- Source
- Full text @ Dev. Biol.
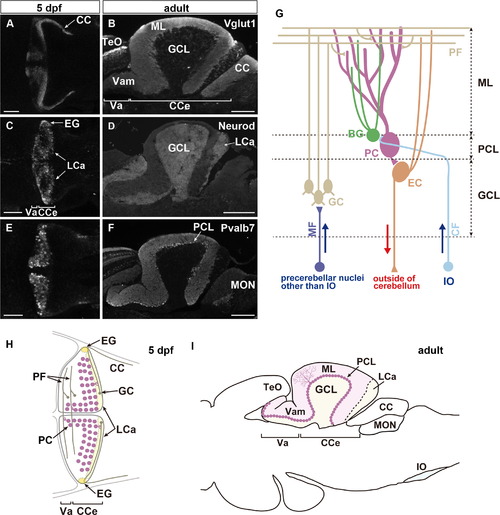
Cerebellar neural circuitry in zebrafish. (A–F) Expression of Vglut1 (A, B), Neurod (C, D), and parvalbumin7 (Pvalb7, E, F) in the cerebellar regions of larvae at 5 dpf (A, C, E, dorsal projection views, with anterior to the left) and adult sagittal sections (B, D, F, optical sections with anterior to the left). Vglut1 and Neurod signals mark the axons and somata of granule cells. Pvalb7 signals mark both neurites (axons and dendrites) and somata of Purkinje cells. (G) Schematic representation of cerebellar neural circuitry. (H, I) Schematic drawing of the cerebellum at 5 dpf (H, dorsal view) and of a sagittal section of the adult midbrain and hindbrain region. Scale bars: 50 µm in A, C, E; 200 µm in B, D, F. |
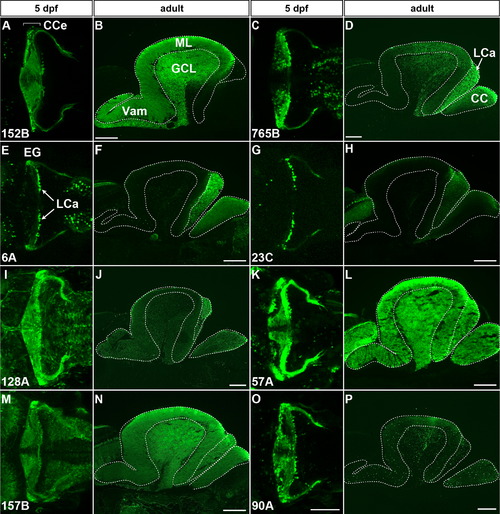
Granule-specific GFF and GFP transgenic lines. (A, B) gSA2AzGFF152B; UAS:GFP. (C, D) gSAIzGFFM765B; UAS:GFP. (E, F) gSAG6A. (G, H) gSAIGFF23C; UAS:GFP. (I, J) SAGFF(LF)128A; UAS:GFP. (K, L) hspGFF57A; UAS:GFP. (M, N) SAGFF(LF)157B; UAS:GFP. (O, P) hspGFFDMC90A; UAS:GFP. To visualize GFF expression, the granule-specific GFF lines (except gSAG6A in E, F) were crossed with the UAS:GFP line. The 5-dpf larvae (A, C, E, G, I, K, M, O, dorsal projection views with anterior to the left) and sagittal sections of adult brains (B, D, F, H, J, L, N, P, optical sections with anterior to the left) were stained with anti-GFP antibody. Note that in the gSA2AzGFF152B; UAS:GFP line GFP was specifically expressed in the granule cells of the CCe, while in the gSAIzGFFM765B; UAS:GFP line GFP was expressed in some granule cells in the CCe and most granule cells in the LCa in adult. The gSAG6A and gSAIGFF23C; UAS:GFP lines expressed GFP in granule cells primarily in the LCa. In the hspGFFDMC90A; UAS:GFP line GFP was expressed in some granule cells in the GCL and LCa, and in some immature granule cells in the ML. Scale bars: 100 µm in O (applied to A, C, E, G, I, K, M, O); 200 µm in B, D, F, H, J, L, N, P. EXPRESSION / LABELING:
|

Granule cell-specific GFF lines, co-staining with granule cell markers. (A–H, Q–T) gSA2AzGFF152B; UAS:GFP. (I–P, U–X) gSAIGFF23C; UAS:GFP. The 5-dpf larvae (A–P, dorsal views with anterior to the left) and sagittal sections of adult brains (Q–X, anterior to the left) were stained with anti-GFP (green) and Vglut1 or Neurod (magenta) antibodies. High magnification images of green (B, F, J, N, R, V), magenta (C, G, K, O, S, W), merged (D, H, L, P, T, X) of the box in A, E, I, M, Q, U. Projection views (A–D, E, I–L, M, Q–U) and optical sections (F–H, N–P, V–X). Note that GFP+ axons and somata were co-stained with anti-Vglut1 (arrowheads in D, L) and Neurod antibodies, respectively. There are Neurod+ and GFP- cells observed in the lobus caudalis of 5-dpf gSAIGFF23C; UAS:GFP cerebellum (Fig. 3N–P), indicating that gSAIGFF23C line marks most but not all granule cells in the lobus caudalis cerebelli. Scale bars: 100 µm in A, E, I, M; 100 µm in Q, U; 20 µm in D, H, L, P (applied to B–D, F–H, J–L, N–P, respectively); 20 µm in T, X (applied to R–T, V–X, respectively). |

Purkinje-specific GFF and membrane tagged Venus/mCherry lines. (A–H) aldoca:gap43-Venus larvae (A–D, dorsal views with anterior to the left) and adult sagittal sections (E–H, with anterior to the left) were co-stained with anti-GFP (Venus, green) and anti-Pvalb7 (magenta) antibodies. Venus signals colocalized with Pvalb7 signals in all the Purkinje cells of 5-dpf larvae (D) and the adult cerebellum (H). Cerebellovestibular tracts are indicated by arrowheads (A, B). (I–L) aldoca:gap43-mCherry larvae (dorsal views with anterior to the left) were co-stained with anti-DsRed (mCherry, magenta) and anti-Pvalb7 (green) antibodies. (M–S) aldoca:GFF; UAS:GFP larvae (M–P, dorsal views with anterior to the left) and adult sagittal sections (Q–V, anterior to the left) were co-stained with anti-GFP (Venus, green) and anti-Pvalb7 (magenta) antibodies. (T–V) High magnification views of the box in S. Only a portion of the Pvalb7+ Purkinje cells stained positive for GFP (L, P). Scale bars: 100 µm in A; 50 µm in D (applied to B–D); 200 µm in E; 50 µm in H (applied to F–H); 100 µm in I; 50 µm in L (applied to J–L); 100 µm in M; 50 µm in P (applied to N–P); 200 µm in S (applied to Q–S); 100 µm in V (applied to T–V). |
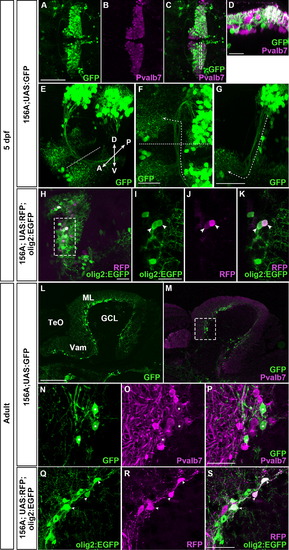
Analysis of the eurydendroid-specific GFF line, hspzGFFgDMC156A. (A–G, L–P) The hspzGFFgDMC156A line was crossed with UAS:GFP. Larvae at 5 dpf (A–G) and adult brain sections (L–P) were stained with anti-GFP (green) and anti-Pvalb7 (magenta) antibodies. (A–C) Dorsal views with anterior to the left. (D) Cross-section image of the dotted box in (C). (E) Dorso-anterior view. (F, G) Dorsal (F) and lateral (G) views of eurydendroid cell axons, with anterior to the left. The eurydendroid axons are marked by a dotted line with an arrowhead in F and G. The midlines are indicated by dotted lines in E and F. (L–P) GFP and Pvalb7 expression in the cerebellum of hspzGFFgDMC156A; UAS:GFP adults. (N–P) High magnification views of the box in M. GFP-expressing cells received the axons of Pvalb7+ Purkinje cells (marked by asterisks in N–P). (H–K, Q–S) Co-expression of GFP and RFP in hspzGFFgDMC156A; UAS:RFP; olig2:EGFP eurydendroid cells. The 5-dpf larvae (H–K) and adult brain sections (Q–S) were stained with anti-GFP (green) and anti-RFP (magenta) antibodies. (I–K) High magnification views of the box in H. (Q–S) Sagittal sections. Some of the RFP+ cells were also GFP+ (marked by arrowheads in I–K, Q–S). Projection views (A–H), optical sections (I–K), and histological sections (L–S). Scale bars: 100 µm in A (applied to A–C); 20 µm in D; 50 µm in F; 50 µm in G; 20 µm in H; 20 µm in I (applied to I–K); 200 µm in L (applied to L, M); 50 µm in P (applied to N–P); 50 µm in S (applied to Q–S). |
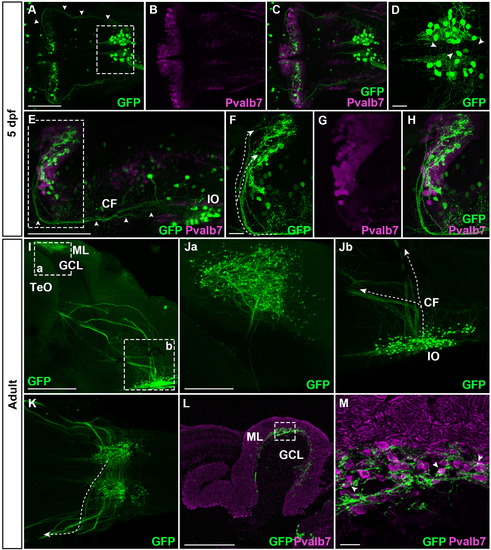
Climbing fibers visualized with the hspGFFDMC28C line. Immunostaining of hspGFFDMC28C; UAS:GFP larvae (A–H) and adult brains (I–M) with anti-GFP (green) and anti-Pvalb7 (magenta) antibodies. CFs are indicated by arrowheads (A, E) or dotted lines (F, Jb, K). (A–C) Dorsal views of the 5-dpf larval hindbrain, with anterior to the left. (D) High magnification view of the box in A. CFs crossing the midline are indicated by arrowheads. (E) Lateral view of the 5-dpf larval hindbrain, with anterior to the left. (F–H) High magnification views of the box in E. (I) Lateral view (with anterior to the left) of the adult brain, subjected to whole mount staining and optical clearing. (Ja, Jb) High magnification views of the boxes in I. (K) Ventral view of the IO region. (L) Sagittal section, with anterior to the left. (M) High magnification view of the box in L. The localization of GFP+ axonal termini on the Pvalb7+ somata of Purkinje cells is indicated by arrowheads. Scale bars: 100 µm in A (applied to A–C); 20 µm in D; 100 µm in E; 20 µm in F (applied to F–H); 400 µm in I; 200 µm in Ja (applied to Ja, Jb, K); 400 µm in L; 20 µm in M. |

Tracing with Kaede shows contralateral projections of CFs in zebrafish. A CF terminal region of the left side of 5-dpf hspGFFDMC28C; UAS:Kaede larvae was laser irradiated. Expression of Kaede and photoconverted Kaede were examined. Cerebellum (CCe, A–I) and IO (J–M) regions. Dorsal views with anterior to the left. The midlines are indicated by dotted lines in A, J–M. (B–E) High magnification views of the box a in A (right side of the cerebellum). (F–I) High magnification views of the box b in A (left side). The CF axon termini on the right side were irradiated. The irradiated area is marked by a dotted box in B. Expression of green (A, B, D, F, H) and photoconverted Kaede (white, C, E, G, I) was detected in the cerebellum (CCe) before (B, C, F, G) and 7 h after laser-mediated photoconversion (D, E, H, I). Expression of green (J, L) and photoconverted Kaede (K, M) was also detected in the IO region before (J, K) and 7 h after the photoconverstion (L, M). Similar contralateral projections were detected from twenty independent experiments. Scale bars: 50 µm in A; 50 µm in B (applied to B, C, F, G); 50 µm in D (applied to D, E, H, I); 40 µm in J (applied to J–M). EXPRESSION / LABELING:
|
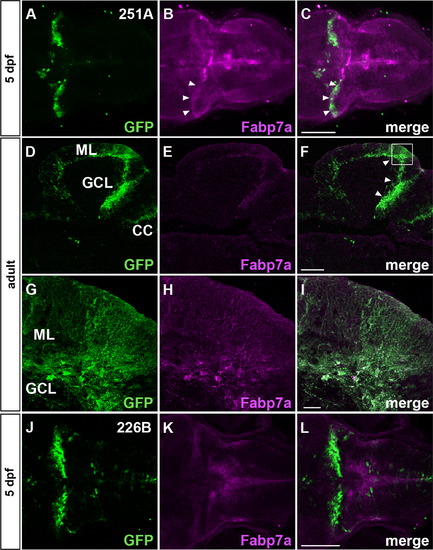
Bergmann glia-specific GFF lines. The SAGFF(LF)251A and SAGFF(LF)226B lines were crossed with UAS:GFP. (A–I) SAGFF(LF)251A; UAS:GFP. (J–L) SAGFF(LF)226B; UAS:GFP. The 5-dpf larvae (A–C, J–L, dorsal projection views with anterior to the left) and sagittal sections of adult brains (D–F, anterior to the left) were stained with anti-GFP (green, A, C, D, F, G, I, J, L) and anti-Fabp7 (magenta, B, C, E, F, H, I, K, L) antibodies. (G–I) High magnification views of the box in F. Note that GFP and Fabp7a staining colocalized only in the cerebella of larvae and adults (marked by arrowheads, B, C, F), indicating that SAGFF(LF)251A; UAS:GFP was expressed only in Bergmann glial cells, and not in the radial glia of other brain regions. SAGFF(LF)226B; UAS:GFP-positive signals were detected in the Bergmann glia of larvae, but not adult cerebella. Scale bars: 100 µm in C (applied to A-C); 200 µm in F (applied to D–F); 20 µm in I (applied to G–I); 100 µm in L (applied to J-L). |

Detection of cerebellar neural circuitry with WGA tracing. The gSA2AzGFF152B; UAS:GFP line was crossed with UAS:AcGFP-P2A-WGA. Sagittal sections of the adult cerebellum were stained with anti-GFP (green), anti-Pvalb7 (magenta), and anti-WGA (cyan) antibodies. (A-D) and (J-M) represent two different areas of the ML/GCL boundary of the cerebellum. Expression of GFP (A, J), Pvalb7 (B, K), and WGA (C, L), and merged images (D, M) are shown. Projection views of histological sections. (E-I) High magnification views of the box in D. (N-R) High magnification views of the box in M. Optical sections (E-I, N-R). Pvalb7+ Purkinje cells that incorporated WGA are indicated by arrowheads (B-D, F-I). Eurydendroid cell with a Pvalb7 soma, that received Pvalb7+ axon(s) and incorporated WGA, is indicated by arrowheads (K-M, O-R). Note both Purkinje and eurydendroid cells are GFP-negative. (S, T) Low magnification views of the hindbrain. Expression of GFP (S-V) and WGA (T, V). (U, V) High magnification views of the box in T (IO region). The ventral bottoms of the hindbrain are indicated by dotted lines (U, V). Note that IO neurons incorporated WGA but GFP-negative. Scale bars: 20 µm in A (applied to A-D); 20 µm in E (applied to E-I); 20 µm in J (applied to J-M); 20 µm in N (applied to N-R); 200 µm in S (applied to S, T); 40 µm in U (applied to U, V). EXPRESSION / LABELING:
|

Development and anatomy of granule cells revealed by gSA2AzGFF152B line. (A–G) Dorsal projection views (A–D) and cross section images (E-G) of gSA2AzGFF152B; UAS:GFP larval cerebella. Single cells on the left and right sides (arrowheads and arrows in A–D, asterisks in E–G) are traced during the indicated periods. Trajectories of the marked somata are shown in D (the positions at 70, 70.5, and 71.5 hpf are indicated by white circles and squares). (H–K) Tol1-mediated transgenesis of UAS:GFP reporter in gSA2AzGFF152B line. 5 pg of UAS:GFP reporter DNA in a Tol1 donor vector (T1-UAS:GFP) and 50 pg of Tol1 transposase mRNA were injected into an one-cell stage gSA2AzGFF152B embryo (H, I). 6.6 pg of T1-UAS:GFP DNA and 16.6 pg of Tol1 transposase mRNA (J, K) were injected into one blastomere of a 4-to-8-cell stage gSA2AzGFF152B embryos. GFP expression was detected at 6 dpf. Axon and dendrite structure are indicated by arrowhead and arrow, respectively, in K. (L–O) Combination of mosaic UAS:Kaede and laser irradiation shows the structure of granule cells at a single cell resolution. gSA2AzGFF152B line was crossed with mosaic (partially silenced) UAS:Kaede line. Single somata of granule cells were marked by laser-irradiation one by one at 3 dpf (one in L, three in M, and four in N, marked by arrowheads). Expression of original (green) and photoconverted Kaede (magenta) is shown in L–N. (O, P) Dorsal view and cross section image for photoconverted Kaede in N. Note granule cells in the corpus cerebelli shows typical T-shaped parallel fibers (marked by dotted lines with arrowheads in P). The midlines are indicated by dotted lines. Scale bars: 25 µm in A (applied to A–D); 20 µm in E (applied to E–G); 50 µm in H, J; 20 µm in I, K; 20 µm in L (applied to L–O); 20 µm in P. EXPRESSION / LABELING:
|
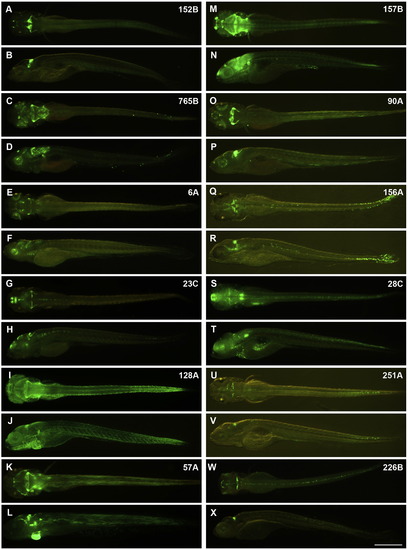
Trap lines. Expression of GFP. 5-dpf larvae. (A, B) gSA2AzGFF152B; UAS:GFP. (C, D) gSAIzGFFM765B, UAS:GFP. (E, F) gSAG6A. (G, H) gSAIGFF23C; UAS:GFP. (I, J) SAGFF(LF)128A; UAS:EGFP. (K, L) hspGFF57A; UAS:GFP. (M, N) SAGFF(LF)157B; UAS:GFP. (O, P) hspGFFDMC90A; UAS:GFP. (Q, R) hspzGFFgDMC156A; UAS:GFP. (S, T) hspGFFDMC28C; UAS:GFP. (U, V) SAGFF(LF)251A; UAS:GFP. (W, X) SAGFF(LF)226B; UAS:GFP. Dorsal views with anterior to the left (A, C, E, G, I, K, M, O, Q, S, U, W). Lateral views with anterior to the left (B, D, F, H, J, L, N, P, R, T, V, X). Scale bar: 50 µm (applied to all panels). |

Trap lines. Expression of GFP. The head region of 5 dpf larvae. (A, B) gSA2AzGFF152B; UAS:GFP. (C, D) gSAIzGFFM765B, UAS:GFP. (E, F) gSAG6A. (G, H) gSAIGFF23C; UAS:GFP. (I, J) SAGFF(LF)128A; UAS:EGFP. (K, L) hspGFF57A; UAS:GFP. (M, N) SAGFF(LF)157B; UAS:GFP. (O, P) hspGFFDMC90A; UAS:GFP. (Q, R) hspzGFFgDMC156A; UAS:GFP. (S, T) hspGFFDMC28C; UAS:GFP. (U, V) SAGFF(LF)251A; UAS:GFP. (W, X) SAGFF(LF)226B; UAS:GFP. Dorsal views with anterior to the left (A, C, E, G, I, K, M, O, Q, S, U, W). Lateral views with anterior to the left (B, D, F, H, J, L, N, P, R, T, V, X). Scale bar: 25 µm (applied to all panels). |

Localization of GFP transcripts in granule cells of gSA2AzGFF152B; UAS:GFP. (A, B) Expression of GFP at 5 dpf was detected by whole mount in situ hybridization. Lateral (A) and dorsal views (B) with anterior to the left. (D, E) Expression of GFP in the adult brain. In situ hybridization of sagittal sections. Anterior to the left. (E) High magnification view of a box in D. Scale bars: 200 µm in B (applied to A, B); 50 µm in D; 25 µm in E. Note that GFP transcripts are detected only in the somata of granule cells (D, E). |
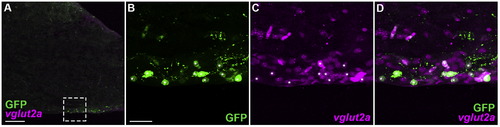
hspGFFDMC28C line marks glutamatergic neurons in the IO. Adult brain sagittal sections of hspGFFDMC28C; UAS:GFP were stained with vglut2a riboprobes (magenta) and anti-GFP antibody (green). (A) Low magnification view of the posterior hindbrain. (B, C, D) High magnification view of a box in A. Note that most of the GFP-positive cells are also vglut2a-positive (marked by asterisks). Scale bars: 100 µm in A; 20 µm in B (applied to B–D). |
Reprinted from Developmental Biology, 397(1), Takeuchi, M., Matsuda, K., Yamaguchi, S., Asakawa, K., Miyasaka, N., Lal, P., Yoshihara, Y., Koga, A., Kawakami, K., Shimizu, T., Hibi, M., Establishment of Gal4 transgenic zebrafish lines for analysis of development of cerebellar neural circuitry, 1-17, Copyright (2015) with permission from Elsevier. Full text @ Dev. Biol.