
- Title
-
Zebrafish neurofibromatosis type 1 genes have redundant functions in tumorigenesis and embryonic development
- Authors
- Shin, J., Padmanabhan, A., de Groh, E.D., Lee, J.S., Haidar, S., Dahlberg, S., Guo, F., He, S., Wolman, M.A., Granato, M., Lawson, N.D., Wolfe, S.A., Kim, S.H., Solnica-Krezel, L., Kanki, J.P., Ligon, K.L., Epstein, J.A., and Look, A.T.
- Source
- Full text @ Dis. Model. Mech.
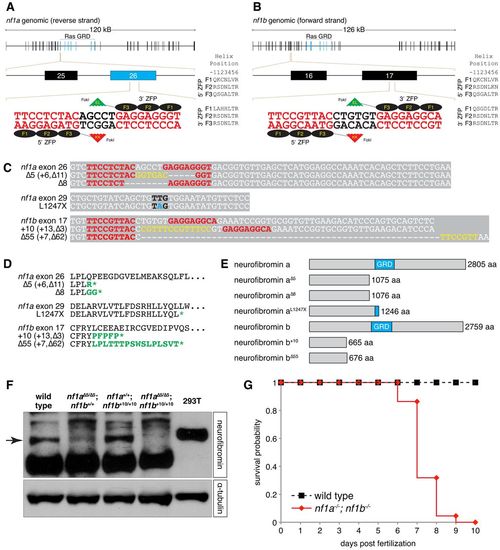
ZFN and TILLING strategies generate null alleles of zebrafish nf1a and nf1b. (A,B) Scheme of site targeted for ZFN-mediated cleavage in exon 26 of nf1a and exon 17 of nf1b. (C) Alignments of nucleotide sequences from wild-type and mutant nf1a and nf1b alleles. ZFN target sites appear in red. Yellow bases represent insertions that arise from repair of ZFN-induced mutagenic lesions. Black bases correspond to the mutated codon in the nf1aL1247X allele generated by a TILLING strategy, with the mutated base appearing in blue. (D) ZFN-induced mutagenic lesions in nf1a and nf1b produce frameshift mutations that lead to truncated protein products following short regions of altered translation, which are indicated in green. The nonsense mutation in the nf1aL1247X allele generated by a TILLING strategy also appears in green. (E) The truncated protein products predicted by the ZFN- and TILLING-induced mutant nf1a/nf1b alleles all harbor complete or partial loss of the neurofibromin GAP-related domain (GRD). (F) Western blot analysis for neurofibromin in protein lysates from 3 dpf wild-type, nf1aΔ5/Δ5; nf1b+/+, nf1a+/+; nf1b+10/+10 and nf1aΔ5/Δ5; nf1b+10/+10 zebrafish larvae (100 μg each) or 293T cells (25 μg) demonstrates absence of Nf1 protein in nf1a-/-; nf1b-/- larvae. Equal loading was confirmed by stripping the membrane and reprobing for α-tubulin. (G) Kaplan-Meier survival analysis demonstrates that 100% of nf1a-/-; nf1b-/- larvae (n=22) die by 10 dpf as compared with 0% of wild-type larvae (n=27). EXPRESSION / LABELING:
|

Loss of nf1a and nf1b causes hyperplasia of OPCs and Schwann cells. (A,B) Confocal images of spinal cords in nf1a-/-; nf1b-/-; Tg(olig2:GFP) larvae (B) demonstrate increased numbers of dorsally migrating (white brackets) olig2:GFP-positive OPCs as compared with wild-type; Tg(olig2:GFP) larvae (A) at 4 dpf. (C,D) Confocal images of spinal cord in nf1a-/-; nf1b-/-; Tg(sox10:GFP) larvae (D) demonstrate increased numbers of both dorsally (white brackets) and ventrally (red brackets) positioned sox10:GFP-positive OPCs as compared with wild-type; Tg(sox10:GFP) larvae (C) at 4 dpf. (E,F) nf1a-/-; nf1b-/-; Tg(sox10:GFP) larvae (F) show an increased number of sox10:GFP-positive Schwann cells associated with the peripheral lateral line nerve (PLLn; white brackets) as compared with wild-type; Tg(sox10:GFP) larvae (E) at 4 dpf. (G,H) Neuronal numbers (olig2:GFP- [green], HuC/D- [magenta] positive) do not increase in concert with OPCs (olig2:GFP- [green], Sox10- [red] positive; arrowheads) in transverse sections through the spinal cord of nf1a/; nf1b-/-; Tg(olig2:GFP) larvae (H) as compared to wild-type; Tg(olig2:GFP) larvae (G) at 4 dpf. (I,J) Increased numbers of PLLn Schwann cells (sox10:GFP- [green], Sox10- [red] positive) are appreciated in transverse sections of nf1a-/-; nf1b-/-; Tg(sox10:GFP) larvae (J) as compared with wild-type; Tg(sox10:GFP) (I) larvae at 4 dpf. (K,L) Quantification of neurons (olig2:GFP-, HuC/D-positive cells) (K) and OPCs (olig2:GFP-, Sox10-positive cells) (L) from transverse sections through the spinal cord of wild-type; Tg(olig2:GFP) and nf1a-/-; nf1b-/-; Tg(olig2:GFP) larvae at 4 dpf. Values indicate mean + s.e.m. per section (n=30 from five each of wild-type and nf1a/; nf1b-/- larvae). (M) Quantification of sox10:GFP-positive Schwann cells in the PLLn of wild-type; Tg(sox10:GFP) and nf1a-/-; nf1b-/-; Tg(sox10:GFP) larvae at 4 dpf. Values indicate mean + s.e.m. per hemisegment (n=5 each for wild-type and nf1a-/-; nf1b-/- larvae). ***P<0.001. Scale bars: 20 μm. |
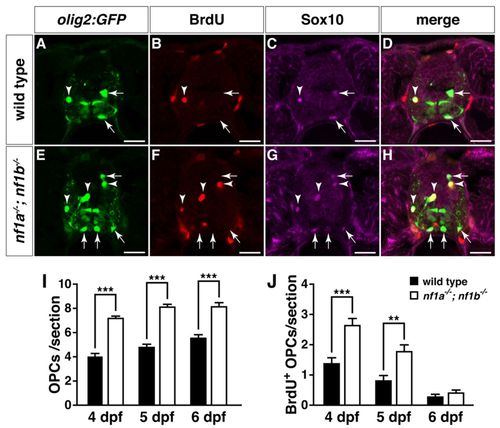
Increased proliferation drives OPC hyperplasia in nf1a-/-; nf1b-/- larvae. (A-H) Transverse spinal cord sections of wild-type3 Tg(olig2:GFP) (A-D) and nf1a-/-; nf1b-/-; Tg(olig2:GFP) larvae (E-H) labeled with anti-BrdU antibody (B,F, red) or anti-SOX10 antibody (C,G, magenta) at 4 dpf. Arrows indicate BrdU-negative, Tg(olig2:GFP)-, Sox10-positive OPCs. Arrowheads indicate BrdU-positive, Tg(olig2:GFP)-, Sox10-positive OPCs. (I,J) Quantification of total (I) and BrdU-positive OPCs (J) from transverse spinal cord sections of wild-type; Tg(olig2:GFP) and nf1a-/-; nf1b-/-; Tg(olig2:GFP) larvae at 4, 5 and 6 dpf. Values indicate mean + s.e.m. per section (n=30 from five each of wild-type and nf1a-/-; nf1b-/- larvae). **P<0.01; ***P<0.001. Scale bars: 20 μm. |
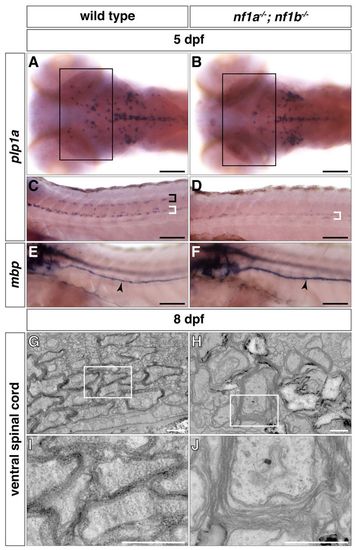
nf1a-/-; nf1b-/- larvae exhibit myelination defects. (A–D) plp1a expression is decreased in glial cells of the midbrain and hindbrain regions (A,B, boxes) as well as the dorsal (black bracket) and ventral (white brackets) spinal cord of nf1a-/-; nf1b-/- larvae (B,D) as compared to wild-type larvae (A,C) by whole-mount in situ hybridization at 5 dpf. (E,F) mbp expression is elevated in Schwann cells of the PLLn (arrowheads) of nf1a-/-; nf1b-/- larvae (F) as compared to wild-type larvae (E) by whole-mount in situ hybridization at 5 dpf. (G-J) Transverse sections through the ventral spinal cord nf1a-/-; nf1b-/-larvae (H, boxed region magnified in J) demonstrate defects in formation of compact myelin sheaths as compared with wild-type larvae (G, boxed region magnified in I) at 8 dpf. Scale bars: 100 μm (A-F) and 0.5 μm (G-J). |
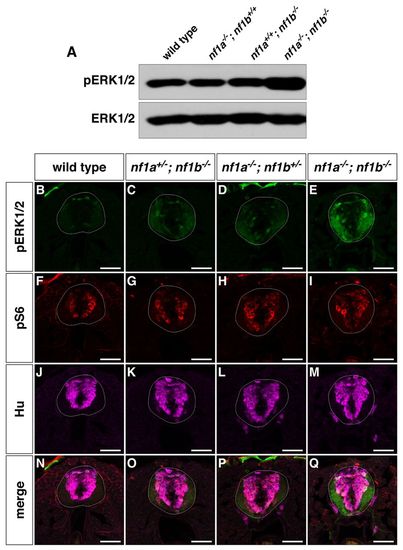
nf1a/nf1b mutants exhibit upregulation of pERK1/2. (A) Western blot analysis for pERK1/2 in protein lysates prepared from wild-type, nf1a-/-; nf1b+/+, nf1a+/+; nf1b-/- and nf1a-/-; nf1b-/- larvae (100 μg) reveals increased pERK1/2 levels in nf1a-/-; nf1b-/- larvae as compared with wild-type, nf1a-/-; nf1b+/+ and nf1a+/+; nf1b-/- larvae at 3 dpf. Equal loading was confirmed by stripping the membrane and reprobing for total ERK1/2. (B-Q) Transverse spinal cord sections of wild-type (B,F,J,N), nf1a+/-; nf1b-/- (C,G,K,O), nf1a-/-; nf1b+/- (D,H,L,P) and nf1a-/-; nf1b-/- (E,I,M,Q) larvae labeled with anti-pERK1/2 antibody (B–E, green), anti-pS6 antibody (F-I, red), or anti-HuC/D antibody (J-M, magenta) demonstrate marked upregulation of pERK1/2 in nf1a-/-; nf1b-/-larvae and intermediate levels of pERK1/2 in larvae harboring a single functioning nf1 allele as compared with wild-type larvae at 4 dpf (n=5 each for wild-type and mutant larvae). Scale bars: 40 μm. EXPRESSION / LABELING:
PHENOTYPE:
|
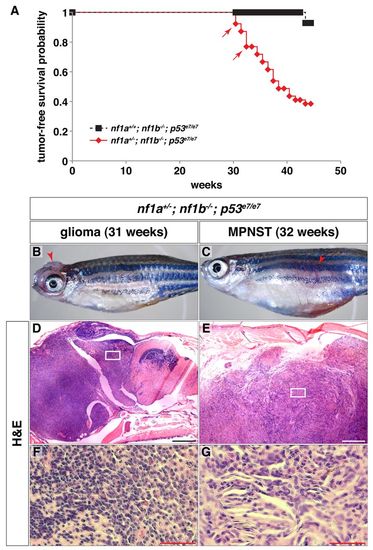
nf1a/nf1b mutants demonstrate increased susceptibility to tumorigenesis in a p53 mutant background. (A) Kaplan-Meier tumor-free survival analysis for nf1a+/-; nf1b-/-; p53e7/e7 (n=39) animals demonstrates significantly decreased survival as compared with nf1a+/+; nf1b-/-; p53e7/e7 (n=14) animals (P<0.001). Arrows indicate ages at which animals were identified with brain tumors demonstrating features of diffuse high-grade gliomas. (B,C) 31-week-old nf1a+/-; nf1b-/-; p53e7/e7 animal with a high-grade glioma (B, arrowhead) and 32-week-old nf1a+/-; nf1b-/-; p53e7/e7 animal with a malignant peripheral nerve sheath tumor (MPNST) (C, arrowhead). (D-G) H&E staining of sagittal sections through the high-grade optic glioma (D, boxed area magnified in F) or MPNST (E, boxed area magnified in G). Scale bars: 200 μm (D,E) and 50 μm (F,G). PHENOTYPE:
|
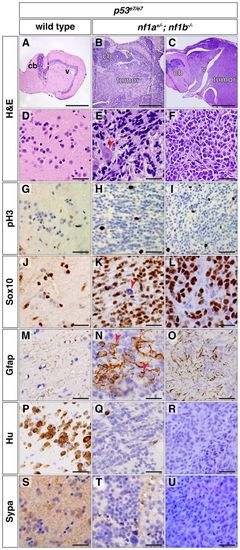
Tumors from nf1a+/-; nf1b-/-; p53e7/e7 animals express glial markers. (A–F) H&E staining of sagittal sections through p53e7/e7 brain tissue (A,D) or brain tumors in nf1a+/-; nf1b-/-; p53e7/e7 animals at 31 (B,E) and 33 (C,F) wpf (cb, cerebellum; v, ventricle). The arrowhead in E shows infiltration of a single cell through the parenchyma and around normal neurons. (G-U) Immunohistochemical analyses for phosphorylated histone H3 (G-I, pH3), SRY-box 10 (J-L, Sox10), glial fibrillary acidic protein (M-O, Gfap), HuC/D (P-R, Hu) and synaptophysin (S-U, Sypa) on sagittal sections through p53e7/e7 brain tissue (G,J,M,P,S) or brain tumors in nf1a+/-; nf1b-/-; p53e7/e7 animals at 31 (H,K,N,Q,T) and 33 (I,L,O,R,U) wpf demonstrate occasional mitoses in tumor tissue (H,I) with most tumor cells staining positive for the oligodendroglial marker Sox10 (K,L), a Sox10-negative subpopulation (K, arrowhead), an astrocytic component (N, arrowheads and O) and the absence of mature neuronal markers HuC/D (Q,R) or synaptophysin (T,U). Scale bars: 450 μm (A-C) and 20 μm (D-U). |
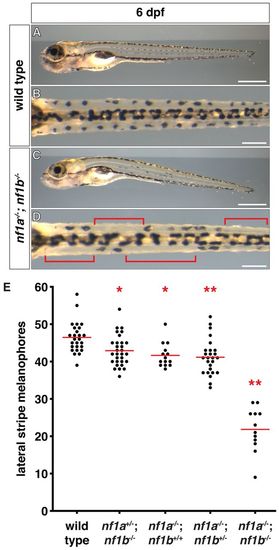
nf1 mutants display decreased lateral stripe melanophores. (A-D) Lateral stripe melanophores of wild-type (A,B) larvae demonstrate a normal uniform pattern that is absent in nf1a-/-; nf1b-/- larvae (C,D) at 6 dpf. The brackets in D highlight regions where melanophores are absent. (E) Quantification of lateral stripe melanophores from wild-type (n=26), nf1a+/-; nf1b-/- (n=30), nf1a-/-; nf1b+/+ (n=14), nf1a-/-; nf1b+/- (n=26) and nf1a-/-; nf1b-/- (n=12) larvae at 6 dpf. Each point represents the number of lateral stripe melanophores in an individual embryo and red lines indicate mean values. *P<0.05, **P<0.01. Scale bars: 0.5 mm (A,C) and 150 μm (B,D). PHENOTYPE:
|

Unillustrated author statements PHENOTYPE:
|