Fig. 2
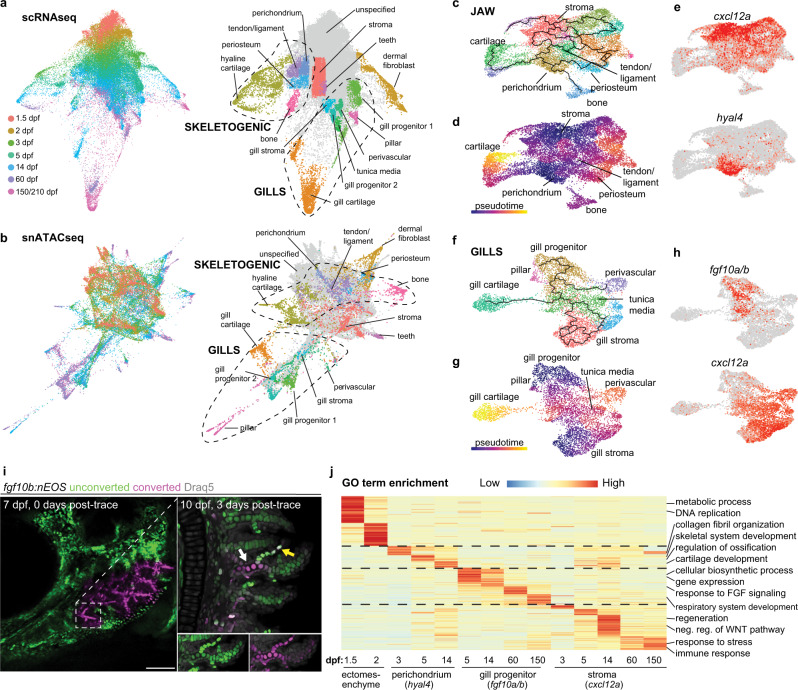
Fig. 2 a, b STITCH plots connect individual scRNAseq and snATACseq datasets across the zebrafish lifetime. Cell type annotations show divergence of CNCC ectomesenchyme into skeletogenic, gill, dermal fibroblast, and stromal branches. c–e Pseudotime analysis using Monocle3 of the jaw skeletogenic subset (combined 5 and 14 dpf) shows a cxcl12a+ stromal branch, and a hyal4+ branch connected to cartilage, bone, periosteum, and tendon and ligament. f–h Pseudotime analysis of gill subsets (combined 5 and 14 dpf) shows a cxcl12a+ stromal branch, and a fgf10a/b+ branch connected to gill pillar, tunica media, and perivascular cells, as well as a distinct type of gill cartilage. i Following UV-mediated photoconversion of fgf10b:nEOS from green to magenta in a subset of filaments, re-imaging 3 days later revealed contribution of converted cells to gill chondrocytes (white arrow) and pillar cells (yellow arrow, white signal reflects mixture of previously converted magenta and continued expression of new unconverted green fgf10b:nEOS) (n = 3). Draq5 labels nuclei in gray. At 10 dpf, below insets show the region designated by the arrows for individual green and magenta channels with Draq5. j Gene ontology (GO) terms of biological processes for the respective clusters at the stages indicated. Heatmap reflects the negative log of the adjusted p value of one-sided Fisher’s exact test. Ectomesenchyme is defined as the average of all cells at 1.5 and 2 dpf stages. Scale bar, 100 μm.

