|
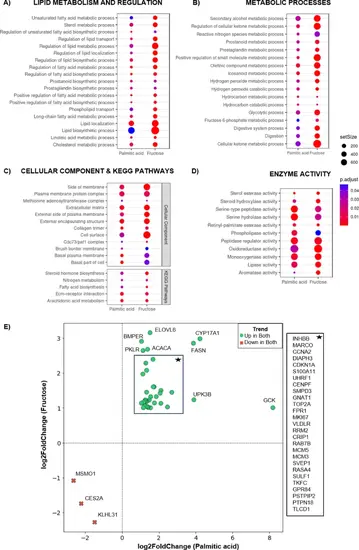
Comparison between palmitic acid- and fructose-based model: The dot plots depict the overlap between the categories (A) GO biological process: Lipid metabolism and regulation (B) GO biological process: Other metabolic processes (C) Cellular component and KEGG pathways (D) GO molecular function: Enzyme activity in palmitic acid and fructose based MAFLD model. The vertical items are the names of GO terms, and the length of horizontal graph represents the gene ratio. The depth of the colour represents the adjusted p value. The area of circle in the graph means gene counts. Constructed with ggplot2 in R package tidyverse (https://www.tidyverse.org/). (E) The scatter plot illustrates commonly dysregulated genes with concordant trends in both the high-fructose diet mouse model (x-axis) and palmitic acid (PA)-fed zebrafish model (y-axis). Green dots indicate upregulated genes, while red crosses represent downregulated genes.
|