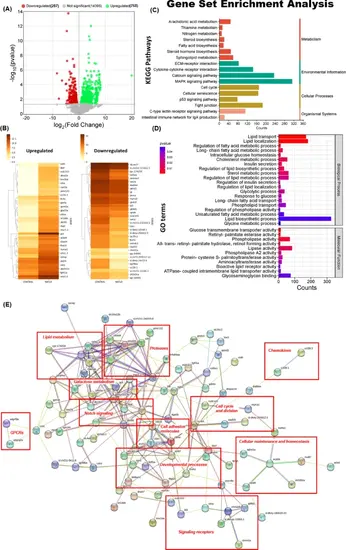
Identification and annotation of differentially expressed genes. (A) Volcano plot of DEGs for MAFLD vs control transcriptomic data. The volcano plot shows the fold-change (x-axis) versus the significance (y-axis) of the identified genes. The significance (p value) and the fold-change were converted to − log10 (p value) and log2 (fold-change), respectively. The vertical and horizontal dotted lines show the cut-off of log2 Fold-change = ± 1.0, and of p value < 0.05, respectively. There were 792 upregulated genes (upper-right, dots coloured green), and 345 downregulated genes (upper-left, dots coloured red). (B) Hierarchical clustering map of DEGs. The horizontal axis shows the names of each group (control and MAFLD) and the vertical axis shows the clusters of DEGs. The left clustermap shows upregulated DEG’s while the right one shows downregulated DEG’s. Colours towards brown represent high expression values and colours towards yellow represent low expression values. Here q value < 0.05 and log2Fold-change = ± 1.0 is taken as level of significance parameters. Constructed with seaborn package in python (https://seaborn.pydata.org/). (C) GSEA KEGG pathway analysis of DEGs (www.kegg.jp/kegg/kegg1.html). The dot plot represents the KEGG pathways on the y-axis and enrichment scores on the x-axis. The dot represents the gene count, greater gene count corresponds to a greater dot. The colour of the dot varies based on the p value. (D) GSEA Gene Ontology analysis of DEGs. The bar plot shows the gene counts (x-axis). GO terms, biological processes and molecular functions are on the y-axis. The colour of the bar varies based on the significance of p value. Constructed with SRplot (https://www.bioinformatics.com.cn/srplot). (E) STRING analysis showing protein–protein interaction between the proteins encoded by dysregulated genes. Some of these are GPCRs, chemokines, proteases, cell adhesion molecules and signaling receptors. Several are involved in galactose metabolism, lipid metabolism, Notch signaling, the cell cycle and division, developmental processes, as well as cellular maintenance and homeostasis.
|
