
FIGURE
Fig. 8
- ID
- ZDB-FIG-251010-20
- Publication
- Bhattacharya et al., 2025 - Zebrafish model of palmitic acid induced MAFLD recapitulates pathways conserved in mice and humans
- Other Figures
- All Figure Page
- Back to All Figure Page
Fig. 8
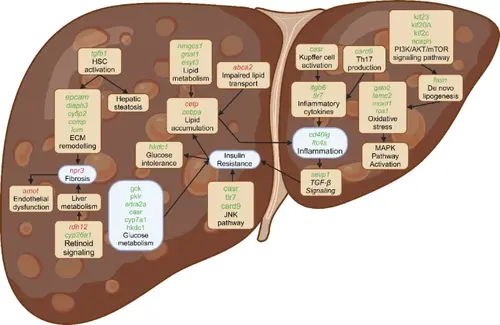
Comparison of human and zebrafish MAFLD models: Genes elevated in both models are highlighted in green, while downregulated genes are highlighted in red. |
Expression Data
Expression Detail
Antibody Labeling
Phenotype Data
Phenotype Detail
Acknowledgments
This image is the copyrighted work of the attributed author or publisher, and
ZFIN has permission only to display this image to its users.
Additional permissions should be obtained from the applicable author or publisher of the image.
Full text @ Sci. Rep.