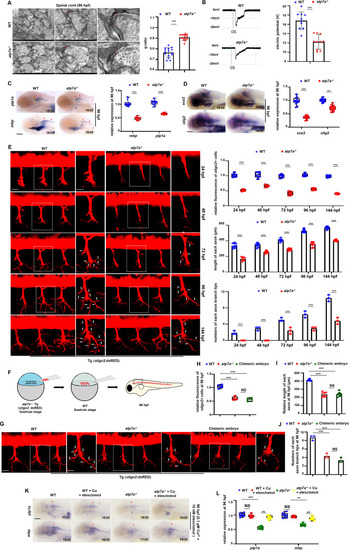
Atp7a functions autonomously in central nervous system (CNS) myelin and axon development during zebrafish embryogenesis. (A) Transmission electron microscopy (TEM) of spinal cord sections in WT or atp7a−/− larvae at 96 hpf (hours post fertilization), and graphs show the myelin g-ratios in WT or atp7a−/− larvae. Each dot represents the data of one axon in the representative images. The calculation assay is followed for the next TEM data. (B) Neurons in WT and atp7a−/− larvae differed in current amplitudes at 96 hpf, and neurons in WT larvae had significantly larger current amplitudes and densities (graphs). Each dot represents the relative level of the current amplitude in an individual embryo or larvae in each group. The calculation assay is followed for the next electrophysiology data. (C) Transcriptional expressions of CNS myelin markers mbp and plp1a in WT or atp7a−/− larvae at 96 hpf, and box and whisker plots show the calculations of the relative expressions of mbp and plp1a. The number n/n in the right down corner in each panel indicates n (changed)/n (total), and n indicates the numbers of the calculated embryos and larvae. Each dot represents the relative level of signal in a representative image in an individual embryo or larvae in each group. The calculation assay is followed for the next WISH data. (D) Transcriptional expression of neural stem and progenitor cell (NSPC) marker sox2 and of oligodendrocyte progenitor cell (OPC) and oligodendrocyte marker olig2 in WT or atp7a−/− larvae at 96 hpf, and the box and whisker plots show the calculation of the relative expressions of sox2 and olig2, respectively. (E) Confocal micrographs of oligo2+ cells in Tg (WT; oligo2: dsRED) and Tg (atp7a−/−; oligo2: dsRED) at 24, 48, 72, 96 and 144 hpf, respectively, and the graphs show the calculations of the relative fluorescence levels in oligo2+dsRED cells and axons, the length of axons, and numbers of each axon branch tip, respectively, in different groups at different stages. Each dot represents the averaged data of axons in a representative image in an individual embryo or larvae. The calculation assay is followed for the next calculation of axon data. (F) The schema shows the predicted spinal cord progenitor cells in Tg (atp7a−/−; oligo2: dsRED) embryos at the gastrula stage are transplanted to WT. (G) Confocal micrographs of oligo2+ cells in WT chimeric embryos transplanted with the predicted spinal cord progenitor cells from Tg (atp7a−/−; oligo2: dsRED) at 96 hpf. (H, I, J) Calculations of the relative fluorescence, length of each axon, and number of each axon branch tip in different groups (graphs). (K) Transcriptional expressions of CNS myelin genes mbp and plp1a in WT or atp7a−/− larvae from groups with or without Cu2+ (0.1 μM) and elesclomol (10 nM) co-treatment at 96 hpf. (L) The calculation of the relative expressions of mbp and plp1a at 96 hpf (box and whisker plots). C, D, K, lateral view, anterior to the left. Scale bar: 100 μm (C, D, K), 50 μm (E, G), 10 μm (E, G, amplified pictures), 1 μm (A, left), 0.5 μm (A, middle), 0.1 μm (A, right), *P < 0.05, **P < 0.01, ***P < 0.001. NS, not significant.
|
