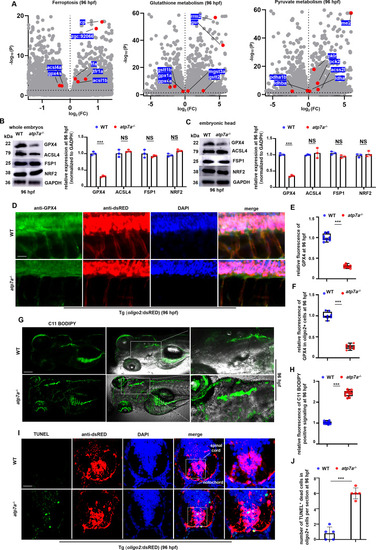
Atp7a deficiency leads to ferroptosis and significant downregulation of GPX4. (A) Scatter plots for ferroptosis genes (left), glutathione metabolism genes (middle), and pyruvate metabolism genes (right) in atp7a−/− larvae at 96 hpf. (B) WB analysis of the relative protein levels of GPX4, ACSL4, FSP1, and NRF2, indicators for ferroptosis, in whole WT or atp7a−/− larvae at 96 hpf, respectively, with GADPH as an internal control (graphs). (C) WB analysis of the relative protein levels of GPX4, ACSL4, FSP1, and NRF2 in the head of WT or atp7a−/− larvae at 96 hpf, with GADPH as an internal control (graphs). (D) Double staining of oligo2+ cells (RED) with GPX4 (GFP) in WT or atp7a−/− larvae at 96 hpf, and the calculation of the relative fluorescence levels of GPX4 (E) and GPX4 fluorescence intensity in oligo2+ cells (F) (box and whisker plots). (G, H) Lipid peroxidation indicator C11 BODIPY staining in WT or atp7a−/− larvae at 96 hpf (H), and the calculation of the relative fluorescence of C11 BODIPY positive signaling in spinal cords at 96 hpf (box and whisker plots) (H). (I) Double staining of oligo2+ cells (RED) with TUNEL signals (green dots) in WT or atp7a−/− larvae at 96 hpf, and the calculation of the number of TUNEL positive signals in the spinal cord (slides) at 96 hpf (graphs) (J). Slides are trans-sections at hindbrain domain. Loci with spinal cords (G, I) in white boxes were amplified. Scale bar: 50 μm (D), 200 μm (G), 100 μm (I, amplified panels in G), 20 μm (amplified panels in I). *P < 0.05, **P < 0.01, ***P < 0.001. NS, not significant. (For interpretation of the references to colour in this figure legend, the reader is referred to the web version of this article.)
|
