
Fig. 5
- ID
- ZDB-FIG-250818-38
- Publication
- Kawasaki et al., 2025 - Meioc-Piwil1 complexes regulate rRNA transcription for differentiation of spermatogonial stem cells
- Other Figures
- All Figure Page
- Back to All Figure Page
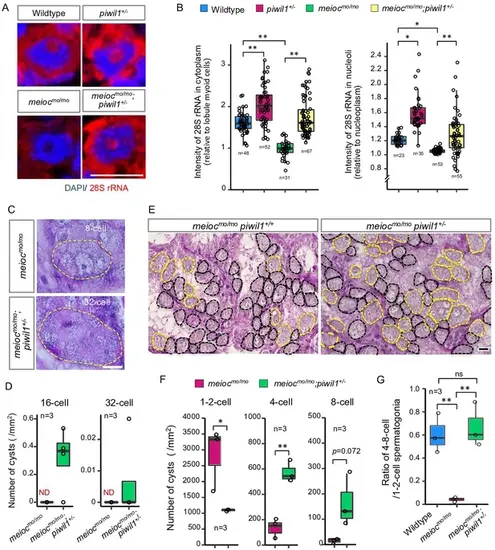
Reduction of Piwil1 compensated phenotypes of meiocmo/mo. (A, B) In situ hybridization of 28S rRNA in wild-type and meiocmo/mo;piwil1+/- spermatogonia (1- to 2-cell cysts). Graphs (B) show the relative signal intensity in the cytoplasm normalized to the intensity of lobule myoid cells (left) and nucleoli normalized to the intensity of the nucleoplasm (right). (C, D) Differentiated spermatogonia in meiocmo/mo and meiocmo/mo;piwil1+/- testes. Yellow dotted lines: differentiated spermatogonia. Graphs (D) show the number of 16-cell and 32-cell cyst spermatogonia per mm2 of sections. ND: not detected. (E–G) meiocmo/mo and meiocmo/mo piwil1+/- testis sections stained with PAS and hematoxylin. Cysts of 1- to 2-cell spermatogonia (black) and 4≤-cell cysts (yellow) are indicated by dotted lines. Graphs show numbers of 1-, 2-, 4-, and 8-cell cysts per mm2 in sections of meiocmo/mo and meiocmo/mo;piwil1+/- testes (F), and ratio of the number of 4- to 8-cell cysts to 1- to 2-cell cysts in wild-type, meiocmo/mo and meiocmo/mo;piwil1+/- (G). *p<0.05, **p<0.01, ns: not significant. Scale bars: 10 µm. |