
FIGURE
Fig. 5 - Supplemental 1
- ID
- ZDB-FIG-250818-39
- Publication
- Kawasaki et al., 2025 - Meioc-Piwil1 complexes regulate rRNA transcription for differentiation of spermatogonial stem cells
- Other Figures
- All Figure Page
- Back to All Figure Page
Fig. 5 - Supplemental 1
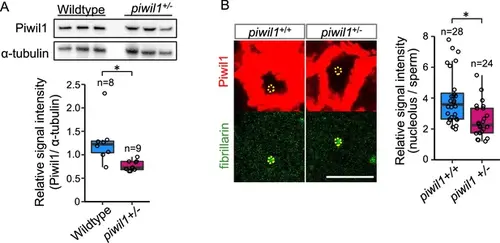
Reduction of Piwil1 in piwil1+/-. (A) Western blot analysis of Piwil1 and α-Tubulin (upper panels) and quantification of Piwil1 (lower panel) in piwil1+/+ and piwil1+/- testes. (B) Immunostaining against Piwil1 and fibrillarin (left panels) and quantification of nucleolar Piwil1 signal intensities (right panel) in piwil1+/+ and piwil1+/- spermatogonia (1- to 2-cell cysts). Yellow dotted lines: nucleoli. For each graph, data were analyzed by Student’s t-test: *p<0.05. |
Expression Data
Expression Detail
Antibody Labeling
Phenotype Data
Phenotype Detail
Acknowledgments
This image is the copyrighted work of the attributed author or publisher, and
ZFIN has permission only to display this image to its users.
Additional permissions should be obtained from the applicable author or publisher of the image.
Full text @ Elife