
FIGURE
Fig. 5 - Supplemental 1
- ID
- ZDB-FIG-250808-56
- Publication
- Wu et al., 2025 - Pu.1/Spi1 dosage controls the turnover and maintenance of microglia in zebrafish and mammals
- Other Figures
-
- Fig. 1
- Fig. 2
- Fig. 2 - Supplemental 1
- Fig. 3
- Fig. 3 - Supplemental 1
- Fig. 3 - Supplemental 2
- Fig. 3 - Supplemental 3
- Fig. 3 - Supplemental 4
- Fig. 3 - Supplemental 5
- Fig. 3 - Supplemental 6
- Fig. 4
- Fig. 5
- Fig. 5 - Supplemental 1
- Fig. 5 - Supplemental 2
- Fig. 5 - Supplemental 3
- Fig. 6
- Fig. 6 - Supplemental 1
- All Figure Page
- Back to All Figure Page
Fig. 5 - Supplemental 1
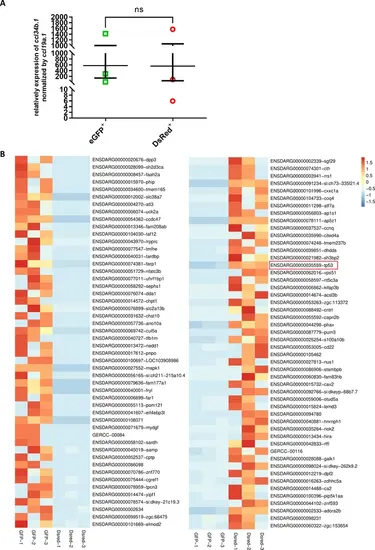
RNA-seq analysis of pu.1-deficient microglia. (A) Relative expression of ccl34b.1 normalized by ccl19a.1 in the picked samples for RNA-seq analysis. (B) Transcripts per million (TPM) heatmap of the top 50 differentially expressed genes in eGFP+ and Dsred+ microglia. Values in the heatmap are centered and scaled in the row direction. The red color represents high expression, while the blue color represents low expression. |
Expression Data
Expression Detail
Antibody Labeling
Phenotype Data
Phenotype Detail
Acknowledgments
This image is the copyrighted work of the attributed author or publisher, and
ZFIN has permission only to display this image to its users.
Additional permissions should be obtained from the applicable author or publisher of the image.
Full text @ Elife